
EPAM Reports Results for Second Quarter 2026
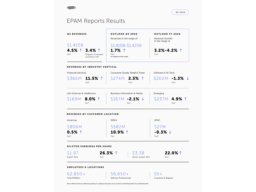 NEWTOWN, Pa., Aug. 6, 2026 /PRNewswire/ -- EPAM Systems, Inc. (NYSE: EPAM), a leading digital and AI transformation company, today announced results for its second quarter ended June 30, 2026.
"Our second quarter results came in better than expected with continued AI-native momentum and ongoing profitability improvement, reflecting solid execution against our multi-year strategy," said Balazs Fejes, CEO & President, EPAM. "As we continue to expand our strategic partnerships and leverage our 30+ years of engineering DNA to build the next generation forward-deployed engineering organization, our conviction in the strategy, the team and our commercial transformation is high."
Second Quarter 2026 Highlights
Cash Flow and Other Metrics
2026 Outlook - Full Year and Third Quarter
Full Year
EPAM expects the following for the full year:
Third Quarter
EPAM expects the following for the third quarter:
Conference Call Information
EPAM will host a conference call to discuss the results on Thursday, August 6, 2026, at 8:00 a.m. ET. The conference call will be available live on the EPAM website at https://investors.epam.com. Please visit the website at least 15 minutes prior to the call to register for the event. For those who cannot access the live webcast, a replay will be available in the Investor Relations section of the website.
About EPAM Systems
EPAM (NYSE: EPAM) is a global leader in AI transformation engineering and integrated consulting, serving Forbes Global 2000 companies and ambitious startups. With over thirty years of expertise in custom software, product and platform engineering, EPAM empowers organizations to become AI-Native enterprises, driving measurable value from innovation and digital investments. Recognized by industry benchmarks and leading analysts as a leader in AI, EPAM delivers globally while engaging locally, making the future real for clients, partners, and employees.
We are proud to be recognized by Forbes, Glassdoor, Newsweek, Time Magazine, Great Place to Work and kununu as a Most Loved Workplace around the world.
Learn more at www.epam.com and follow us on LinkedIn.
Non-GAAP Financial Measures
EPAM supplements results reported in accordance with United States generally accepted accounting principles, referred to as GAAP, with non-GAAP financial measures. Management believes these measures help illustrate underlying trends in EPAM's business and uses the measures to establish budgets and operational goals, communicate internally and externally, for managing EPAM's business and evaluating its performance. Management also believes these measures help investors compare EPAM's operating performance with its results in prior periods. EPAM anticipates that it will continue to report both GAAP and certain non-GAAP financial measures in its financial results, including non-GAAP results that exclude stock-based compensation expenses, acquisition-related costs including amortization of acquired intangible assets, impairment of assets, expenses associated with EPAM's humanitarian commitment to its professionals in Ukraine, employee separation costs incurred in connection with restructuring programs, certain other one-time charges and benefits, changes in fair value of contingent consideration, foreign exchange gains and losses, excess tax benefits and tax shortfalls related to stock-based compensation, and the related effect on income taxes of the pre-tax adjustments. Management also compares revenues on an "organic constant currency basis," which is a non-GAAP financial measure. This measure excludes the effect of acquisitions by removing revenues from an acquired company in the twelve months after completing an acquisition and foreign currency exchange rate fluctuations by translating current period revenues into U.S. dollars at the weighted average exchange rates of the prior period of comparison. Because EPAM's reported non-GAAP financial measures are not calculated in accordance with GAAP, these measures are not comparable to GAAP and may not be comparable to similarly described non-GAAP measures reported by other companies within EPAM's industry. Consequently, EPAM's non-GAAP financial measures should not be evaluated in isolation or supplant comparable GAAP measures, but rather, should be considered together with the information in EPAM's consolidated financial statements, which are prepared in accordance with GAAP.
Forward-Looking Statements
This press release includes estimates and statements which may constitute forward-looking statements made pursuant to the safe harbor provisions of the Private Securities Litigation Reform Act of 1995, the accuracy of which are necessarily subject to risks, uncertainties, and assumptions as to future events that may not prove to be accurate. Our estimates and forward-looking statements are mainly based on our current expectations and estimates of future events and trends, which affect or may affect our business and operations. These statements may include words such as "may," "will," "should," "believe," "expect," "anticipate," "intend," "plan," "estimate"or similar expressions. Those future events and trends may relate to, among other things, developments relating to the war in Ukraine and escalation of the war in the surrounding region, political and civil unrest or military action in the geographies where we conduct business and operate, difficult conditions in global capital markets, foreign exchange markets, global trade and the broader economy, the adoption and implementation of artificial intelligence technologies by EPAM and its clients, and the effect that these events may have on client demand and our revenues, operations, access to capital, and profitability. Other factors that could cause actual results to differ materially from those expressed or implied include general economic conditions, the risk factors discussed in the Company's most recent Annual Report on Form 10-K and the factors discussed in the Company's Quarterly Reports on Form 10-Q, particularly under the headings "Management's Discussion and Analysis of Financial Condition and Results of Operations" and "Risk Factors"and other filings with the Securities and Exchange Commission. Although we believe that these estimates and forward-looking statements are based upon reasonable assumptions, they are subject to several risks and uncertainties and are made based on information currently available to us. EPAM undertakes no obligation to update or revise any forward-looking statements, whether as a result of new information, future events, or otherwise, except as may be required under applicable securities law.
EPAM SYSTEMS, INC. AND SUBSIDIARIES
CONDENSED CONSOLIDATED STATEMENTS OF INCOME
(Unaudited)
(In thousands, except per share data)
Three Months Ended
June 30,
Six Months Ended
June 30,
2026
2025
2026
2025
Revenues
$ 1,414,767
$ 1,353,443
$ 2,814,828
$ 2,655,135
Operating expenses:
Cost of revenues (exclusive of depreciation and amortization)
985,199
964,012
1,997,251
1,916,020
Selling, general and administrative expenses
245,245
231,681
484,947
450,598
Depreciation and amortization expense
32,101
31,274
63,640
62,711
Income from operations
152,222
126,476
268,990
225,806
Interest and other income (loss), net
(1,821)
3,519
(239)
9,333
Foreign exchange loss
(9,850)
(6,227)
(7,552)
(16,954)
Income before provision for income taxes
140,551
123,768
261,199
218,185
Provision for income taxes
37,572
35,742
75,699
56,677
Net income
$ 102,979
$ 88,026
$ 185,500
$ 161,508
Net income per share:
Basic
$ 1.97
$ 1.56
$ 3.50
$ 2.86
Diluted
$ 1.97
$ 1.56
$ 3.49
$ 2.84
Shares used in calculation of net income per share:
Basic
52,197
56,319
52,991
56,548
Diluted
52,267
56,536
53,220
56,898
EPAM SYSTEMS, INC. AND SUBSIDIARIES
CONDENSED CONSOLIDATED BALANCE SHEETS
(Unaudited)
(In thousands, except par value)
As of
June 30,
2026
As of
December 31,
2025
Assets
Current assets
Cash and cash equivalents
$ 789,397
$ 1,296,077
Trade receivables and contract assets, net of allowance of $3,939 and $6,350, respectively
1,268,036
1,108,201
Prepaid and other current assets
158,556
129,610
Total current assets
2,215,989
2,533,888
Property and equipment, net
204,967
202,387
Operating lease right-of-use assets, net
124,999
114,875
Intangible assets, net
372,969
406,586
Goodwill
1,203,048
1,210,564
Deferred tax assets
295,947
295,115
Other noncurrent assets
156,167
138,721
Total assets
$ 4,574,086
$ 4,902,136
Liabilities
Current liabilities
Accounts payable
$ 41,551
$ 55,329
Accrued compensation and benefits expenses
495,961
608,232
Accrued expenses and other current liabilities
208,531
250,688
Income taxes payable, current
19,093
25,520
Operating lease liabilities, current
39,301
37,173
Total current liabilities
804,437
976,942
Long-term debt
25,000
25,034
Operating lease liabilities, noncurrent
87,942
81,497
Deferred tax liabilities, noncurrent
74,505
76,969
Other noncurrent liabilities
62,901
63,886
Total liabilities
1,054,785
1,224,328
Commitments and contingencies
Equity
Stockholders' equity
Common stock, $0.001 par value; 160,000 shares authorized; 51,585 shares issued
and outstanding at June 30, 2026, and 54,274 shares issued and outstanding at
December 31, 2025
52
54
Additional paid-in capital
1,487,973
1,390,423
Retained earnings
2,035,664
2,268,204
Accumulated other comprehensive income (loss)
(4,970)
18,545
Total EPAM Systems, Inc. stockholders' equity
3,518,719
3,677,226
Noncontrolling interest in consolidated subsidiaries
582
582
Total equity
3,519,301
3,677,808
Total liabilities and equity
$ 4,574,086
$ 4,902,136
EPAM SYSTEMS, INC. AND SUBSIDIARIES
Reconciliations of Non-GAAP Financial Measures to Comparable GAAP Financial Measures
(Unaudited)
(In thousands, except percentages and per share amounts)
Reconciliation of year-over-year revenue growth as reported on a GAAP basis to revenue growth on an organic constant currency
basis is presented in the table below:
Three Months Ended
June 30, 2026
Six Months Ended
June 30, 2026
Revenue growth as reported
4.5 %
6.0 %
Inorganic revenue
— %
— %
Foreign exchange rates
(1.1) %
(2.5) %
Revenue growth on an organic constant currency basis
3.4 %
3.5 %
Reconciliation of various income statement amounts from GAAP to non-GAAP for the three and six months ended June 30, 2026 and 2025:
Three Months Ended
June 30, 2026
Six Months Ended
June 30, 2026
GAAP
Adjustments
Non-GAAP
GAAP
Adjustments
Non-GAAP
Cost of revenues (exclusive of depreciation and amortization) (1)
$ 985,199
$ (23,361)
$ 961,838
$ 1,997,251
$ (46,771)
$ 1,950,480
Selling, general and administrative expenses (2)
$ 245,245
$ (39,474)
$ 205,771
$ 484,947
$ (82,314)
$ 402,633
Income from operations (3)
$ 152,222
$ 80,444
$ 232,666
$ 268,990
$ 164,412
$ 433,402
Operating margin
10.8 %
5.6 %
16.4 %
9.6 %
5.8 %
15.4 %
Net income (4)
$ 102,979
$ 73,831
$ 176,810
$ 185,500
$ 146,535
$ 332,035
Diluted earnings per share
$ 1.97
$ 3.38
$ 3.49
$ 6.24
Three Months Ended
June 30, 2025
Six Months Ended
June 30, 2025
GAAP
Adjustments
Non-GAAP
GAAP
Adjustments
Non-GAAP
Cost of revenues (exclusive of depreciation and amortization) (1)
$ 964,012
$ (18,232)
$ 945,780
$ 1,916,020
$ (42,773)
$ 1,873,247
Selling, general and administrative expenses (2)
$ 231,681
$ (40,349)
$ 191,332
$ 450,598
$ (74,572)
$ 376,026
Income from operations (3)
$ 126,476
$ 76,417
$ 202,893
$ 225,806
$ 152,837
$ 378,643
Operating margin
9.3 %
5.7 %
15.0 %
8.5 %
5.8 %
14.3 %
Net income (4)
$ 88,026
$ 68,765
$ 156,791
$ 161,508
$ 133,298
$ 294,806
Diluted earnings per share
$ 1.56
$ 2.77
$ 2.84
$ 5.18
Items (1) through (4) above are detailed in the table below with the specific cross-reference noted in the appropriate item.
Three Months Ended
June 30,
Six Months Ended
June 30,
2026
2025
2026
2025
Stock-based compensation expenses
$ 22,833
$ 18,161
$ 45,686
$ 42,084
Humanitarian support in Ukraine (a)
528
576
1,085
1,194
Poland R&D incentives (b)
—
(505)
—
(505)
Total adjustments to GAAP cost of revenues (1)
23,361
18,232
46,771
42,773
Stock-based compensation expenses
23,568
20,397
50,634
44,930
Cost Optimization charges (c)
13,940
16,275
27,336
21,586
Humanitarian support in Ukraine (a)
1,961
3,282
4,370
7,014
Other acquisition-related expenses
1
292
7
862
One-time charges (benefits)
4
103
(33)
180
Total adjustments to GAAP selling, general and administrative expenses (2)
39,474
40,349
82,314
74,572
Amortization of acquired intangible assets
17,609
17,836
35,327
35,492
Total adjustments to GAAP income from operations (3)
80,444
76,417
164,412
152,837
Foreign exchange loss
9,850
6,227
7,552
16,954
Change in fair value of contingent consideration included in Interest and other income, net
1,435
(232)
2,420
(1,969)
Impairment of financial assets
356
—
356
—
Gain on financial instrument
—
—
—
(350)
Provision for income taxes:
Tax effect on non-GAAP adjustments
(19,997)
(18,291)
(39,128)
(38,201)
Tax shortfall related to stock-based compensation
1,743
1,106
11,592
563
Net discrete charge (benefit) from tax planning (d)
—
3,538
(669)
3,464
Total adjustments to GAAP net income (4)
$ 73,831
$ 68,765
$ 146,535
$ 133,298
(a)
Humanitarian support in Ukraine includes expenses related to EPAM's $100 million humanitarian commitment in response to Russia's invasion of Ukraine to support EPAM professionals and their families in and displaced from Ukraine. These expenses are incremental to those expenses incurred prior to the crisis, clearly separable from normal operations, and not expected to recur once the crisis has subsided and operations return to normal.
(b)
We have excluded from non-GAAP results the portion of the benefit from Poland R&D incentives related to qualifying activities performed in 2023 as it represents a nonrecurring one-time benefit.
(c)
Cost Optimization charges include employee separation costs incurred in connection with the programs initiated in the second quarter of 2024 and second quarter of 2025. Consistent with the Company's historical non-GAAP policy, costs incurred in connection with formal restructuring initiatives have been excluded from non-GAAP results as these are attributable to targeted restructuring efforts and not expected to recur once the respective Cost Optimization program is completed.
(d)
Net discrete charge (benefit) related to the implementation of tax planning to disregard certain foreign subsidiaries as separate entities for U.S. income tax purposes. Consistent with the Company's historical non-GAAP policy, the charge (benefit) related to the implementation of tax planning has been excluded from non-GAAP results as it is one-time and unusual in nature.
EPAM SYSTEMS, INC. AND SUBSIDIARIES
Reconciliations of Guidance Non-GAAP Financial Measures to Comparable GAAP Financial Measures
(Unaudited)
The below guidance constitutes forward-looking statements within the meaning of the federal securities laws and is
based on a number of assumptions that are subject to change and many of which are outside the control of the
Company. Actual results may differ materially from the Company's expectations depending on factors discussed in
the Company's filings with the Securities and Exchange Commission.
Reconciliation of expected year-over-year revenue growth on a GAAP basis to expected revenue growth on an organic
constant currency basis is presented in the table below:
Third Quarter 2026
Full Year 2026
(at midpoint of range)
Revenue growth
1.7 %
3.2% to 4.2%
Foreign exchange rates impact
0.1 %
(1.2) %
Inorganic revenue growth
— %
— %
Revenue growth on an organic constant currency basis
1.8 %
2.0% to 3.0%
Reconciliation of expected GAAP to non-GAAP income from operations as a percentage of revenues is presented in the table below:
Third Quarter 2026
Full Year 2026
GAAP income from operations as a percentage of revenues
11.0% to 12.0%
10.5% to 11.0%
Stock-based compensation expenses
3.1 %
3.2 %
Included in cost of revenues (exclusive of depreciation and amortization)
1.5 %
1.5 %
Included in selling, general and administrative expenses
1.6 %
1.7 %
Humanitarian support in Ukraine (a)
0.2 %
0.2 %
Cost Optimization charges (c)
— %
0.4 %
Amortization of acquired intangible assets
1.2 %
1.2 %
Non-GAAP income from operations as a percentage of revenues (e)
15.5% to 16.5%
15.5% to 16.0%
(e)
EPAM has not included the impact of potential future one-time charges including asset impairments, unusual gains and losses, expenses incurred in connection with future cost optimization actions, and other acquisition-related expenses because the Company is unable to predict these amounts with reasonable certainty.
Reconciliation of expected GAAP to non-GAAP effective tax rate is presented in the table below:
Third Quarter 2026
Full Year 2026
GAAP effective tax rate (approximately)
25.0 %
27.0 %
Tax effect on non-GAAP adjustments
(0.8) %
(0.8) %
Tax shortfall related to stock-based compensation
(0.2) %
(2.3) %
Net discrete benefit from tax planning (d)
— %
0.1 %
Non-GAAP effective tax rate (approximately)
24.0 %
24.0 %
Reconciliation of expected GAAP to non-GAAP diluted earnings per share is presented in the table below:
Third Quarter 2026
Full Year 2026
GAAP diluted earnings per share
$2.33 to $2.41
$8.22 to $8.38
Stock-based compensation expenses
0.85
3.55
Included in cost of revenues (exclusive of depreciation and amortization)
0.39
1.66
Included in selling, general and administrative expenses
0.46
1.89
Humanitarian support in Ukraine (a)
0.05
0.20
Cost Optimization charges (c)
—
0.52
One-time charges (e)
0.02
0.03
Amortization of acquired intangible assets
0.34
1.34
Change in fair value of contingent consideration
—
0.05
Foreign exchange loss
0.06
0.22
Provision for income taxes:
Tax effect on non-GAAP adjustments
(0.28)
(1.30)
Tax shortfall related to stock-based compensation
0.01
0.26
Net discrete benefit from tax planning (d)
—
(0.01)
Non-GAAP diluted earnings per share (e)
$3.38 to $3.46
$13.08 to $13.24
SOURCE EPAM Systems, Inc.