
AB InBev Reports Second Quarter 2026 Results
 BRUSSELS--( BUSINESS WIRE)--Anheuser-Busch InBev (Brussel:ABI) (BMV:ANB) (JSE:ANH) (NYSE:BUD):
Regulated information 1
“Cheers to beer – our performance this quarter reflects the strength of the beer category and the consistent execution of our strategy. Through investment in our megabrands and mega platforms, innovation and offering more choices across more occasions, we are strengthening the cultural relevance of our brands with consumers. Thank you to our colleagues for their commitment and disciplined execution, which position us well to continue our momentum.” – Michel Doukeris, CEO, AB InBev
Revenue
+5.6%
Revenue increased by 5.6% in 2Q26 with revenue per hl growth of 4.2% and by 5.7% in HY26 with revenue per hl growth of 4.3%.
Reported revenue increased by 11.0% in 2Q26 to 16 660 million USD and by 11.5% in HY26 to 31 927 million USD, positively impacted by currency translation.
6.2% increase in combined revenues of megabrands in 2Q26, led by Corona, which grew by 17% outside of its home market.
27% increase in revenue of no-alcohol beer in 2Q26.
44% increase in revenue of Beyond Beer in 2Q26.
50% increase in Gross Merchandise Value (GMV) from sales of third-party products through BEES Marketplace to reach 1.2 billion USD in 2Q26.
+0.9%
Volumes increased by 0.9% in 2Q26, with beer volumes up by 1.1% and non-beer volumes down by 1.1%.
Volumes increased by 0.8% in HY26, with beer volumes up by 1.2% and non-beer volumes down by 1.5%.
Normalized EBITDA
+5.8%
Normalized EBITDA increased by 5.8% to 5 938 million USD in 2Q26, with a margin expansion of 4bps to 35.6%.
Normalized EBITDA increased by 5.6% to 11 375 million USD in HY26, with a margin contraction of 5bps to 35.6%.
Underlying Profit
2 390 million USD
Underlying Profit was 2 390 million USD in 2Q26 compared to 1 950 million USD in 2Q25 and was 4 314 million USD in HY26 compared to 3 556 million USD in HY25.
Reported profit attributable to equity holders of AB InBev was 3 751 million USD in 2Q26 compared to 1 676 million USD in 2Q25, and was 6 314 million in HY26 compared to 3 824 million in HY25, with HY25, 2Q26 and HY26 positively impacted by non-underlying items.
Underlying EPS
1.21 USD
Underlying EPS increased by 23.4% to 1.21 USD in 2Q26, compared to 0.98 USD in 2Q25, and increased by 22.1% to 2.18 USD in HY26, compared to 1.79 USD in HY25.
On a constant currency basis, Underlying EPS increased by 12.9% in 2Q26 and by 11.0% in HY26.
Net Debt to EBITDA
2.86x
Net debt to normalized EBITDA ratio was 2.86x at 30 June 2026 compared to 3.27x at 30 June 2025 and 2.87x at 31 December 25.
The 2026 Half Year Financial Report is available on our website at www.ab-inbev.com.
Management comments
Consistent and compounding growth with beer volume up by 1.1% and a 23.4% Underlying EPS increase
The momentum of our business continued in 2Q26, with broad-based volume growth and a 23.4% increase in Underlying EPS. While the consumer environment remains dynamic, consistent execution of our strategy and investment in our megabrands and mega platforms enabled solid top- and bottom-line results. We strengthened our portfolio brand power and estimate that we gained market share across our footprint, maintaining or gaining share in 70% of our markets.
Revenue increased by 5.6%, with total volume growth of 0.9% and a revenue per hl increase of 4.2%, driven by revenue management and positive mix from premiumization and Beyond Beer. Beer volumes grew by 1.1%, with record high second quarter volumes in Mexico, Colombia, and Ecuador. Beer volumes in Brazil returned to growth, and in the US we delivered continued top-line growth and market share gains in both beer and Beyond Beer.
EBITDA increased by 5.8% with flattish margins as overhead management enabled increased sales and marketing investment and offset transactional FX headwinds. Free cash flow increased by 2.5 billion USD versus HY25 to 3.9 billion USD, driven by disciplined execution and the continued optimization of our business.
Key highlights from the quarter included: global megabrand momentum, with Corona, Stella Artois and Michelob Ultra growing revenue by 17%, 19% and 21%, respectively, outside of their home markets; successful activation of the FIFA World Cup across our markets, supporting growth of Michelob Ultra in the US and providing a platform to expand the brand across key markets in Latin America; no-alcohol beer revenue growth of 27%, Beyond Beer revenue growth of 44%, and BEES Marketplace GMV growth of 50% to 1.2 billion USD.
Progressing our strategic priorities
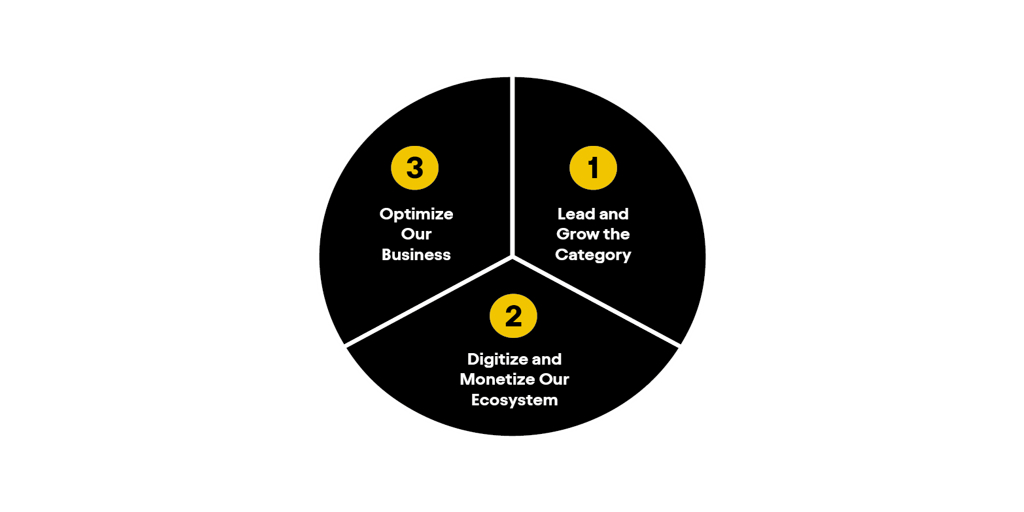
We are executing on three key strategic pillars to deliver consistent growth and long-term value creation.
(1) Lead and grow the category:
We strengthened our portfolio brand power and estimate that we gained or maintained share in 70% of our markets in 2Q26.
(2) Digitize and monetize our ecosystem:
BEES Marketplace GMV increased by 50% versus 2Q25 to 1.2 billion USD from third-party products. Overall BEES GMV increased by 16% versus 2Q25 to 15.0 billion USD.
(3) Optimize our business:
We continued to strengthen our balance sheet, with net debt to EBITDA improving to 2.86x as of 30 June 2026 from 3.27x as of 30 June 2025.
(1) Lead and grow the category
Investment in our megabrands and mega platforms continued to build portfolio brand power, with sales and marketing investment reaching 4.1 billion USD in HY26, up 9% versus HY25. According to the Kantar BrandZ 2026 report, our portfolio holds 8 of the top 10 most valuable beer brands in the world, with Corona and Budweiser ranked #1 and #2, respectively. Our mega platforms strengthened the cultural relevance of our brands during some of the world’s largest moments of celebration, including the Winter Olympics, Roland Garros, Wimbledon and the FIFA World Cup. Across these occasions, our portfolio achieved the #1 share of digital engagement and generated 850 million consumer engagements on social media. Our marketing capabilities were recognized as we were named the Cannes Lions 2026 Creative Marketer of the Year, making us the only company in history to receive this recognition three times.
We continued to execute on our category expansion levers and estimate that the number of legal drinking age consumers purchasing our portfolio increased in HY26 with gains in Beyond Beer and Balanced Choices.
(2) Digitize and monetize our ecosystem
(3) Optimize our business
Continued momentum and reliable compounding growth
In HY26, our business delivered 5.7% revenue growth, 5.6% EBITDA growth and a 22.1% increase in Underlying EPS, driven by beer volume growth, revenue and cost management capabilities, and positive mix. We strengthened our portfolio brand power through investment in our megabrands and mega platforms, scaling our innovations and providing more choices across more occasions. Performance across our megabrands, Balanced Choices, Beyond Beer and BEES Marketplace reflects the strength of our portfolio and the consistent execution of our strategy.
The continued momentum of our business, disciplined execution by our teams and the strength of the beer category reinforce our confidence in our ability to deliver our FY26 outlook and create a future with more cheers.
2026 Outlook
(i) Overall Performance: We expect our EBITDA to grow in line with our medium-term outlook of between 4-8%. The outlook for FY26 reflects our current assessment of inflation and other macroeconomic conditions.
(ii) Net Finance Costs: Net pension interest expenses and accretion expenses are expected to be in the range of 190 to 220 million USD per quarter, depending on currency and interest rate fluctuations. We expect the average gross debt coupon in FY26 to be approximately 4%.
(iii) Effective Tax Rate (ETR): We expect the normalized ETR in FY26 to be in the range of 26% to 28%. The ETR outlook does not consider the impact of potential future changes in legislation.
(iv) Net Capital Expenditure: We expect net capital expenditure of between 3.5 and 4.0 billion USD in FY26.
Figure 1. Consolidated performance
in USD Mio, except EPS in USD per share and Volumes in thousand hls
2Q25
2Q26
Organic
growth
Volumes
143 347
144 003
0.9
%
Beer
125 620
126 945
1.1
%
Non-Beer
17 727
17 058
(1.1
)%
Revenue
15 004
16 660
5.6
%
Gross profit
8 446
9 579
7.5
%
Gross margin
56.3
%
57.5
%
99bps
Normalized EBITDA
5 301
5 938
5.8
%
Normalized EBITDA margin
35.3
%
35.6
%
4bps
Normalized EBIT
4 013
4 604
8.0
%
Normalized EBIT margin
26.7
%
27.6
%
58bps
Profit attributable to equity holders of AB InBev
1 676
3 751
Underlying Profit
1 950
2 390
Basic EPS
0.84
1.90
Underlying EPS
0.98
1.21
HY25
HY26
Organic
growth
Volumes
279 615
280 412
0.8
%
Beer
243 005
245 426
1.2
%
Non-Beer
36 611
34 987
(1.5
)%
Revenue
28 632
31 927
5.7
%
Gross profit
16 029
18 225
7.4
%
Gross margin
56.0
%
57.1
%
88bps
Normalized EBITDA
10 156
11 375
5.6
%
Normalized EBITDA margin
35.5
%
35.6
%
(5)bps
Normalized EBIT
7 601
8 677
7.6
%
Normalized EBIT margin
26.5
%
27.2
%
46bps
Profit attributable to equity holders of AB InBev
3 824
6 314
Underlying Profit
3 556
4 314
Basic EPS
1.92
3.20
Underlying EPS
1.79
2.18
Figure 2. Volumes
in thousand hls
2Q25
Scope
Organic
2Q26
Organic growth
growth
Total
Beer
North America
22 376
218
(164
)
22 430
(0.7
)%
(0.8
)%
Middle Americas
38 822
(634
)
1 806
39 994
4.7
%
4.8
%
South America
34 199
-
466
34 665
1.4
%
3.9
%
EMEA
24 172
(135
)
201
24 239
0.8
%
0.9
%
Asia Pacific
23 716
(21
)
(1 109
)
22 586
(4.7
)%
(4.7
)%
Global Export and Holding Companies
62
14
12
89
16.3
%
16.3
%
AB InBev Worldwide
143 347
(557
)
1 213
144 003
0.9
%
1.1
%
HY25
Scope
Organic
HY26
Organic growth
growth
Total
Beer
North America
42 218
121
(779
)
41 561
(1.8
)%
(1.9
)%
Middle Americas
73 903
(1 362
)
3 439
75 979
4.7
%
5.2
%
South America
75 089
-
341
75 430
0.5
%
2.2
%
EMEA
44 924
(230
)
476
45 169
1.1
%
1.2
%
Asia Pacific
43 365
(39
)
(1 192
)
42 134
(2.8
)%
(2.7
)%
Global Export and Holding Companies
116
22
1
139
0.8
%
0.8
%
AB InBev Worldwide
279 615
(1 489
)
2 286
280 412
0.8
%
1.2
%
Key Markets Performance
United States: Portfolio momentum drove beer and Beyond Beer share gains and continued top-line growth
Mexico: Market share gain and margin expansion drove mid-single digit top- and high-single digit bottom-line growth
Colombia: Record high volumes drove double-digit top- and bottom-line growth
Brazil: Market share gain and an improved industry drove beer volume growth and a double-digit bottom-line increase
Europe: Volume growth and premiumization drove a low-single digit top-line increase
South Africa: Disciplined revenue management and margin expansion drove mid-single digit top- and bottom-line growth
China: Top- and bottom-line declined, impacted by volume performance in a soft industry
Highlights from our other markets
Consolidated Income Statement
Figure 3. Consolidated income statement
in USD Mio
2Q25
2Q26
Organic
growth
Revenue
15 004
16 660
5.6
%
Cost of sales
(6 558
)
(7 082
)
(3.2
)%
Gross profit
8 446
9 579
7.5
%
SG&A
(4 624
)
(5 175
)
(6.5
)%
Other operating income/(expenses)
191
200
(7.9
)%
Normalized EBIT
4 013
4 604
8.0
%
Non-underlying items above EBIT
(45
)
(42
)
Net finance income/(expense)
(1 062
)
(1 057
)
Non-underlying net finance income/(expense)
(234
)
1 402
Share of results of associates
84
96
Non-underlying share of results of associates
9
-
Income tax expense
(741
)
(918
)
Profit
2 024
4 084
Profit attributable to non-controlling interest
347
333
Profit attributable to equity holders of AB InBev
1 676
3 751
Normalized EBITDA
5 301
5 938
5.8
%
Underlying Profit
1 950
2 390
HY25
HY26
Organic
growth
Revenue
28 632
31 927
5.7
%
Cost of sales
(12 602
)
(13 702
)
(3.6
)%
Gross profit
16 029
18 225
7.4
%
SG&A
(8 812
)
(9 917
)
(6.5
)%
Other operating income/(expenses)
383
369
(9.7
)%
Normalized EBIT
7 601
8 677
7.6
%
Non-underlying items above EBIT
(94
)
14
Net finance income/(expense)
(2 046
)
(2 107
)
Non-underlying net finance income/(expense)
368
2 033
Share of results of associates
135
148
Non-underlying share of results of associates
9
-
Income tax expense
(1 404
)
(1 704
)
Profit
4 568
7 061
Profit attributable to non-controlling interest
744
747
Profit attributable to equity holders of AB InBev
3 824
6 314
Normalized EBITDA
10 156
11 375
5.6
%
Underlying Profit
3 556
4 314
Non-underlying items above EBIT & Non-underlying share of results of associates
Figure 4. Non-underlying items above EBIT & Non-underlying share of results of associates
in USD Mio
2Q25
2Q26
HY25
HY26
Restructuring
(35
)
(11
)
(47
)
(33
)
Business and asset disposals (including impairment losses)
(10
)
(17
)
(47
)
61
Acquisition-related costs (business combinations)
-
(14
)
-
(14
)
Non-underlying items in EBIT
(45
)
(42
)
(94
)
14
Non-underlying share of results of associates
9
-
9
-
Normalized EBIT excludes negative non-underlying items of 42 million USD in 2Q26 and positive non-underlying items of 14 million USD in HY26.
Net finance income/(expense)
Figure 5. Net finance income/(expense)
in USD Mio
2Q25
2Q26
HY25
HY26
Net interest expense
(663
)
(583
)
(1 284
)
(1 196
)
Accretion expense and interest on pensions
(184
)
(196
)
(351
)
(413
)
Other financial results
(214
)
(278
)
(410
)
(498
)
Net finance income/(expense)
(1 062
)
(1 057
)
(2 046
)
(2 107
)
Non-underlying net finance income/(expense)
Figure 6. Non-underlying net finance income/(expense)
in USD Mio
2Q25
2Q26
HY25
HY26
Mark-to-market
(263
)
1 402
339
2 033
Gain/(loss) on bond redemption and other
29
-
29
-
Non-underlying net finance income/(expense)
(234
)
1 402
368
2 033
Non-underlying net finance income includes mark-to-market gains on derivative instruments entered into in order to hedge our share-based payment programs and shares issued in relation to the combinations with Grupo Modelo and SAB.
The number of shares covered by the hedging of our share-based payment program, the deferred share instrument and the restricted shares are shown below, together with the opening and closing share prices.
Figure 7. Non-underlying equity derivative instruments
2Q25
2Q26
HY25
HY26
Share price at the start of the period (Euro)
56.92
59.72
48.25
54.90
Share price at the end of the period (Euro)
58.24
72.66
58.24
72.66
Number of equity derivative instruments at the end of the period (in million)
100.5
90.5
100.5
90.5
Income tax expense
Figure 8. Income tax expense
in USD Mio
2Q25
2Q26
HY25
HY26
Income tax expense
741
918
1 404
1 704
Effective tax rate
27.7%
18.7%
24.1%
19.8%
Normalized effective tax rate
25.3%
26.1%
25.6%
25.7%
The HY26 and HY25 effective tax rates were positively impacted by non-taxable gains from derivatives related to the hedging of share-based payment programs and the hedging of the shares issued in a transaction related to the combinations with Grupo Modelo and SAB. The increase in Normalized ETR in HY26 compared to HY25 was primarily due to negative country mix.
Underlying EPS
Figure 9. Underlying EPS
in USD per share, except number of shares in million
2Q25
2Q26
HY25
HY26
Normalized EBITDA
2.67
3.01
5.11
5.76
Depreciation, amortization and impairment
(0.65
)
(0.68
)
(1.28
)
(1.37
)
Normalized EBIT
2.02
2.33
3.82
4.39
Net finance income/(expense)
(0.53
)
(0.54
)
(1.03
)
(1.07
)
Income tax expense
(0.38
)
(0.47
)
(0.71
)
(0.85
)
Associates & non-controlling interests
(0.13
)
(0.12
)
(0.31
)
(0.31
)
Hyperinflation impacts
0.01
0.00
0.02
0.02
Underlying EPS
0.98
1.21
1.79
2.18
Weighted average number of ordinary and restricted shares
1 989
1 976
1 989
1 976
Reconciliation of IFRS and Non-IFRS Financial Measures
Profit attributable to equity holders and Underlying Profit
Figure 10. Underlying Profit
in USD Mio
2Q25
2Q26
HY25
HY26
Profit attributable to equity holders of AB InBev
1 676
3 751
3 824
6 314
Net impact of non-underlying items on profit
261
(1 367
)
(305
)
(2 034
)
Hyperinflation impacts
14
7
37
35
Underlying Profit
1 950
2 390
3 556
4 314
Basic and Underlying EPS
Figure 11. Basic and Underlying EPS
in USD per share, except number of shares in million
2Q25
2Q26
HY25
HY26
Basic EPS
0.84
1.90
1.92
3.20
Net impact of non-underlying items
0.13
(0.69
)
(0.15
)
(1.03
)
Hyperinflation impacts
0.01
0.00
0.02
0.02
Underlying EPS
0.98
1.21
1.79
2.18
FX translation impact
-
(0.10
)
-
(0.20
)
Underlying EPS in constant currency
0.98
1.11
1.79
1.98
Weighted average number of ordinary and restricted shares
1 989
1 976
1 989
1 976
Profit attributable to equity holders and Normalized EBITDA
Figure 12. Reconciliation of Normalized EBITDA to Profit attributable to equity holders of AB InBev
in USD Mio
2Q25
2Q26
HY25
HY26
Profit attributable to equity holders of AB InBev
1 676
3 751
3 824
6 314
Non-controlling interests
347
333
744
747
Profit
2 024
4 084
4 568
7 061
Income tax expense
741
918
1 404
1 704
Share of results of associates
(84
)
(96
)
(135
)
(148
)
Non-underlying share of results of associates
(9
)
-
(9
)
-
Net finance (income)/expense
1 062
1 057
2 046
2 107
Non-underlying net finance (income)/expense
234
(1 402
)
(368
)
(2 033
)
Non-underlying items above EBIT (incl. impairment losses)
45
42
94
(14
)
Normalized EBIT
4 013
4 604
7 601
8 677
Depreciation, amortization and impairment
1 288
1 335
2 555
2 698
Normalized EBITDA
5 301
5 938
10 156
11 375
Normalized EBITDA, Normalized EBIT and Underlying Profit are non-IFRS financial measures used by AB InBev to reflect the company’s underlying performance. Underlying EPS and constant currency Underlying EPS are non-IFRS financial measures that AB InBev believes are useful to investors because they facilitate comparisons of EPS from period to period.
Normalized EBITDA is calculated by adjusting profit attributable to equity holders of AB InBev to exclude: (i) non-controlling interest; (ii) income tax expense; (iii) share of results of associates; (iv) non-underlying share of results of associates; (v) net finance income or cost; (vi) non-underlying net finance income or cost; (vii) non-underlying items above EBIT; and (viii) depreciation, amortization and impairment.
Underlying Profit is calculated by adjusting profit attributable to equity holders of AB InBev to exclude: (i) non-underlying items and (ii) hyperinflation impacts. Underlying EPS is calculated as Underlying Profit divided by the weighted average number of ordinary and restricted shares. Constant currency Underlying EPS is calculated as Underlying EPS excluding the effects of foreign currency translation by translating current period figures using the exchange rates from the same period in the prior year.
Normalized EBITDA, Normalized EBIT and Underlying Profit are not accounting measures under IFRS and should not be considered as an alternative to profit attributable to equity holders as a measure of operational performance, or an alternative to cash flow as a measure of liquidity. Underlying EPS and constant currency Underlying EPS are not accounting measures under IFRS and should not be considered as alternatives to earnings per share as a measure of operating performance on a per share basis. These non-IFRS financial measures do not have a standard calculation method and AB InBev’s definition of Normalized EBITDA, Normalized EBIT, Underlying Profit, Underlying EPS and constant currency Underlying EPS may not be comparable to that of other companies.
Cash Flows and Financial position
Figure 13. Cash Flow Statement (million USD)
HY25
HY26
Operating activities
Profit of the period
4 568
7 061
Interest, taxes and non-cash items included in profit
5 736
4 459
Cash flow from operating activities before changes in working capital and use of provisions
10 304
11 520
Change in working capital
(3 655
)
(2 355
)
Pension contributions and use of provisions
(278
)
(158
)
Interest and taxes (paid)/received
(3 801
)
(3 866
)
Dividends received
135
101
Cash flow from/(used in) operating activities
2 704
5 241
Investing activities
Net capex
(1 350
)
(1 360
)
Sale/(acquisition) and others related to subsidiaries, net of cash
(4
)
(757
)
Net proceeds from sale/(acquisition) of other assets
47
310
Cash flow from/(used in) investing activities
(1 306
)
(1 807
)
Financing activities
Net (repayments of) / proceeds from borrowings
68
246
Dividends paid
(3 147
)
(2 596
)
Share buyback
(1 901
)
(1 301
)
Payment of lease liabilities
(354
)
(364
)
Derivative financial instruments
114
(319
)
Sale/(acquisition) of non-controlling interests
(314
)
(3 389
)
Other financing cash flows
(303
)
219
Cash flow from/(used in) financing activities
(5 837
)
(7 505
)
Net increase/(decrease) in cash and cash equivalents
(4 438
)
(4 071
)
Our free cash flow (defined as cash flow from operating activities less net capex) increased by 2 526 million USD to reach 3 881 million USD in HY26. Our cash and cash equivalents decreased by (4 071) million USD in HY26, compared to a decrease of (4 438) million USD in HY25, with the following movements:
Our net debt increased to 64.2 billion USD as of 30 June 2026 from 60.9 billion USD as of 31 December 2025. Our net debt to normalized EBITDA ratio was 2.86x as of 30 June 2026. Our optimal capital structure is a net debt to normalized EBITDA ratio of around 2x.
We continue to proactively manage our debt portfolio. 98% of our bond portfolio holds a fixed-interest rate, 52% is denominated in currencies other than USD and maturities are well-distributed across the next several years.
As of 30 June 2026, we had total liquidity of 18.1 billion USD, which consisted of 10.1 billion USD available under committed long-term credit facilities and 8.0 billion USD of cash, cash equivalents and short-term investments in debt securities less bank overdrafts.
Notes
To facilitate the understanding of AB InBev’s underlying performance, the analyses of growth, including all comments in this press release, unless otherwise indicated, are based on organic growth and normalized numbers. In other words, financials are analyzed eliminating the impact of changes in currencies on translation of foreign operations, and scope changes. Since 1Q24, the definition of organic revenue growth has been amended to cap the price growth in Argentina to a maximum of 2% per month (26.8% year-over-year). Corresponding adjustments are made to all income statement related items in the organic growth calculations through scope changes. Scope changes also represent the impact of acquisitions and divestitures, the start or termination of activities or the transfer of activities between segments, curtailment gains and losses and year over year changes in accounting estimates and other assumptions that management does not consider as part of the underlying performance of the business. Beer volumes and revenue include primarily beer, no-alcohol beer, other malt-based alcohol beverages and spirits-based beverages. Non-beer volumes and revenue include primarily carbonated soft drinks and energy drinks. In addition, beer and non-beer categories include not only brands that we own or license, but also third-party brands that we brew and sell, and third-party products that we sell through our distribution network. The organic growth of our global brands, Budweiser, Stella Artois, and Corona excludes exports to Australia for which a perpetual license was granted to a third party upon disposal of the Australia operations in 2020. All references per hectoliter (per hl) exclude US non-beverage activities. Whenever presented in this document, all performance measures (EBITDA, EBIT, profit, tax rate, EPS) are presented on a “normalized” basis, which means they are presented before non-underlying items. Non-underlying items are either income or expenses which do not occur regularly as part of the normal activities of the Company. They are presented separately because they are important for the understanding of the underlying sustainable performance of the Company due to their size or nature. Normalized measures are additional measures used by management and should not replace the measures determined in accordance with IFRS as an indicator of the Company’s performance. Effective 1 January 2026, Cervecería Bucanero S.A., a Cuban company in which we indirectly hold a 50% equity interest through our subsidiary Ambev, is accounted for as an associate using the equity method of accounting. The impact of this change in presentation is reflected as a scope change. We are reporting the results from Argentina applying hyperinflation accounting since 3Q18. The IFRS rules (IAS 29) require us to restate the year-to-date results for the change in the general purchasing power of the local currency, using official indices before converting the local amounts at the closing rate of the period. In 2Q26, we reported a negative impact from hyperinflation accounting on the profit attributable to equity holders of AB InBev of 7 million USD. The impact in 2Q26 Basic EPS was less than 0.01 USD. Values in the figures and annexes may not add up, due to rounding. 2Q26 and HY26 EPS is based upon a weighted average of 1 976 million shares compared to a weighted average of 1 989 million shares for 2Q25 and HY25.
Legal disclaimer
This release contains “forward-looking statements”. These statements are based on the current expectations and views of future events and developments of the management of AB InBev and are naturally subject to uncertainty and changes in circumstances. The forward-looking statements contained in this release include statements other than historical facts and include statements typically containing words such as “will”, “may”, “should”, “believe”, “intends”, “expects”, “anticipates”, “targets”, “ambition”, “estimates”, “likely”, “foresees” and words of similar import. All statements other than statements of historical facts are forward-looking statements. You should not place undue reliance on these forward-looking statements, which reflect the current views of the management of AB InBev, are subject to numerous risks and uncertainties about AB InBev and are dependent on many factors, some of which are outside of AB InBev’s control. There are important factors, risks and uncertainties that could cause actual outcomes and results to be materially different, including, but not limited to the risks and uncertainties relating to AB InBev that are described under Item 3.D of AB InBev’s Annual Report on Form 20-F filed with the SEC on 3 March 2026. Many of these risks and uncertainties are, and will be, exacerbated by any further worsening of the global business and economic environment, including as a result of foreign currency exchange rate fluctuations and ongoing geopolitical instability. Other unknown or unpredictable factors could cause actual results to differ materially from those in the forward-looking statements. The forward-looking statements should be read in conjunction with the other cautionary statements that are included elsewhere, including AB InBev’s most recent Form 20-F and other reports furnished on Form 6-K, and any other documents that AB InBev has made public. Any forward-looking statements made in this communication are qualified in their entirety by these cautionary statements and there can be no assurance that the actual results or developments anticipated by AB InBev will be realized or, even if substantially realized, that they will have the expected consequences to, or effects on, AB InBev or its business or operations. Except as required by law, AB InBev undertakes no obligation to publicly update or revise any forward-looking statements, whether as a result of new information, future events or otherwise. The half year 2026 (HY26) financial data set out in Figure 1 (except for the volume information), Figures 3 to 6, 8, 10, 12 and 13 of this press release have been extracted from the group’s unaudited condensed consolidated interim financial statements as of and for the six-month period ended 30 June 2026, which have been reviewed by our statutory auditors PwC Bedrijfsrevisoren BV/Reviseurs d’Entreprises SRL in accordance with the standards of the Public Company Accounting Oversight Board (United States). The second quarter 2026 (2Q26) financial data set out in Figure 1 (except for the volume information), Figures 3 to 6, 8, 10, 12 and 13, and the financial data included in Figures 7, 9, 11 and 14 of this press release have been extracted from the underlying accounting records as of and for the six-month period ended 30 June 2026. The interim sustainability data set out on page 3 are from unaudited internal databases. These have been calculated on a consistent basis with the group’s consolidated sustainability statements as of and for the twelve months ended 31 December 2025, for which limited assurance was provided by our statutory auditors PwC Bedrijfsrevisoren BV/Reviseurs d’Entreprises SRL in accordance with CSRD. References in this document to materials on our websites, such as www.ab-inbev.com, are included as an aid to their location and are not incorporated by reference into this document.
Conference call and webcast
Investor Conference call and webcast on Thursday, 30 July 2026:
3.00pm Brussels / 2.00pm London / 9.00am New York
Registration details:
Webcast (listen-only mode):
AB InBev 2Q26 Results Webcast
To join by phone, please use one of the following two phone numbers:
Toll-Free: +1-877-407-8029
Toll: +1-201-689-8029
About AB InBev
Anheuser-Busch InBev (AB InBev) is a publicly traded company (Euronext: ABI) based in Leuven, Belgium, with secondary listings on the Mexico (MEXBOL: ANB) and South Africa (JSE: ANH) stock exchanges and with American Depositary Receipts on the New York Stock Exchange (NYSE: BUD). As a company, we dream big to create a future with more cheers. We are always looking to serve up new ways to meet life’s moments, move our industry forward and make a meaningful impact in the world. We are committed to building great brands that stand the test of time and to brewing the best beers using the finest ingredients. Beer is the drink for moderation, and for over a century, AB InBev has championed responsible drinking. We are committed to providing our consumers with Balanced Choices to enjoy on any occasion. We also invest in marketing that aims to reinforce positive behaviors, and we work with communities, customers, and partners to promote responsible consumption through evidence-based initiatives.
Our diverse portfolio of well over 400 beer brands includes global brands Budweiser®, Corona®, Stella Artois® and Michelob Ultra®; multi-country brands Beck’s®, Hoegaarden® and Leffe®; and local champions such as Aguila®, Antarctica®, Bud Light®, Brahma®, Cass®, Castle®, Castle Lite®, Cristal®, Harbin®, Jupiler®, Modelo Especial®, Quilmes®, Victoria®, Sedrin®, and Skol®. Our brewing heritage dates back more than 600 years, spanning continents and generations. From our European roots at the Den Hoorn brewery in Leuven, Belgium. To the pioneering spirit of the Anheuser & Co brewery in St. Louis, US. To the creation of the Castle Brewery in South Africa during the Johannesburg gold rush. To Bohemia, the first brewery in Brazil. Geographically diversified with a balanced exposure to developed and developing markets, we leverage the collective strengths of approximately 137 000 colleagues based in more than 40 countries worldwide. For 2025, AB InBev’s reported revenue was 59.3 billion USD (excluding JVs and associates).
Annex 1: Segment reporting (2Q)
AB InBev Worldwide
2Q25
Scope
Currency
Translation
Organic
Growth
2Q26
Organic
Growth
Volumes
143 347
(557
)
-
1 213
144 003
0.9
%
Revenue
15 004
(6
)
822
840
16 660
5.6
%
Cost of sales
(6 558
)
13
(326
)
(211
)
(7 082
)
(3.2
)%
Gross profit
8 446
6
496
630
9 579
7.5
%
SG&A
(4 624
)
(41
)
(209
)
(300
)
(5 175
)
(6.5
)%
Other operating income/(expenses)
191
7
17
(15
)
200
(7.9
)%
Normalized EBIT
4 013
(28
)
304
315
4 604
8.0
%
Normalized EBITDA
5 301
(34
)
370
301
5 938
5.8
%
Normalized EBITDA margin
35.3
%
35.6
%
4bps
North America
2Q25
Scope
Currency
Translation
Organic
Growth
2Q26
Organic
Growth
Volumes
22 376
218
-
(164
)
22 430
(0.7
)%
Revenue
3 844
90
7
99
4 039
2.6
%
Cost of sales
(1 537
)
(36
)
(2
)
(2
)
(1 577
)
(0.1
)%
Gross profit
2 307
53
5
97
2 463
4.2
%
SG&A
(1 122
)
(30
)
(2
)
(77
)
(1 232
)
(6.9
)%
Other operating income/(expenses)
10
0
(0
)
6
16
61.7
%
Normalized EBIT
1 195
23
3
26
1 247
2.2
%
Normalized EBITDA
1 372
27
3
6
1 408
0.5
%
Normalized EBITDA margin
35.7
%
34.9
%
(74)bps
Middle Americas
2Q25
Scope
Currency
Translation
Organic
Growth
2Q26
Organic
Growth
Volumes
38 822
(634
)
-
1 806
39 994
4.7
%
Revenue
4 340
(77
)
408
419
5 091
9.8
%
Cost of sales
(1 516
)
42
(132
)
(91
)
(1 697
)
(6.2
)%
Gross profit
2 824
(35
)
276
328
3 394
11.8
%
SG&A
(987
)
13
(91
)
(95
)
(1 160
)
(9.8
)%
Other operating income/(expenses)
3
1
(1
)
(16
)
(14
)
-
Normalized EBIT
1 839
(21
)
185
217
2 220
11.9
%
Normalized EBITDA
2 149
(20
)
211
220
2 560
10.3
%
Normalized EBITDA margin
49.5
%
50.3
%
23bps
South America
2Q25
Scope
Currency
Translation
Organic
Growth
2Q26
Organic
Growth
Volumes
34 199
-
-
466
34 665
1.4
%
Revenue
2 529
6
236
191
2 961
7.6
%
Cost of sales
(1 314
)
(14
)
(106
)
(29
)
(1 463
)
(2.2
)%
Gross profit
1 215
(8
)
130
162
1 499
13.4
%
SG&A
(863
)
(4
)
(67
)
(78
)
(1 012
)
(9.0
)%
Other operating income/(expenses)
104
9
15
19
146
18.7
%
Normalized EBIT
456
(4
)
77
103
633
23.0
%
Normalized EBITDA
692
1
94
99
886
14.3
%
Normalized EBITDA margin
27.4
%
29.9
%
171bps
EMEA
2Q25
Scope
Currency
Translation
Organic
Growth
2Q26
Organic
Growth
Volumes
24 172
(135
)
-
201
24 239
0.8
%
Revenue
2 489
(37
)
145
81
2 677
3.3
%
Cost of sales
(1 252
)
21
(73
)
(17
)
(1 321
)
(1.3
)%
Gross profit
1 237
(17
)
72
65
1 357
5.3
%
SG&A
(764
)
(6
)
(37
)
(35
)
(841
)
(4.5
)%
Other operating income/(expenses)
56
(3
)
1
(15
)
39
(28.9
)%
Normalized EBIT
529
(25
)
35
14
554
2.9
%
Normalized EBITDA
800
(21
)
51
13
843
1.7
%
Normalized EBITDA margin
32.1
%
31.5
%
(49)bps
Asia Pacific
2Q25
Scope
Currency
Translation
Organic
Growth
2Q26
Organic
Growth
Volumes
23 716
(21
)
-
(1 109
)
22 586
(4.7
)%
Revenue
1 658
11
26
(47
)
1 648
(2.8
)%
Cost of sales
(771
)
1
(9
)
30
(750
)
3.9
%
Gross profit
886
12
17
(17
)
898
(1.9
)%
SG&A
(520
)
(13
)
(7
)
(21
)
(561
)
(4.0
)%
Other operating income/(expenses)
17
(0
)
1
(8
)
9
(47.5
)%
Normalized EBIT
383
(1
)
11
(46
)
347
(11.9
)%
Normalized EBITDA
533
3
15
(58
)
493
(10.9
)%
Normalized EBITDA margin
32.2
%
29.9
%
(269)bps
Global Export and Holding Companies
2Q25
Scope
Currency
Translation
Organic
Growth
2Q26
Organic
Growth
Volumes
62
14
-
12
89
16.3
%
Revenue
144
2
1
97
244
66.1
%
Cost of sales
(168
)
(1
)
(4
)
(102
)
(275
)
(60.7
)%
Gross profit
(23
)
1
(3
)
(6
)
(32
)
(26.3
)%
SG&A
(368
)
(1
)
(6
)
6
(369
)
1.6
%
Other operating income/(expenses)
2
0
2
(0
)
3
(3.7
)%
Normalized EBIT
(389
)
(0
)
(7
)
(0
)
(397
)
(0.1
)%
Normalized EBITDA
(245
)
(23
)
(5
)
21
(252
)
7.9
%
Annex 2: Segment reporting (HY)
AB InBev Worldwide
HY25
Scope
Currency
Translation
Organic
Growth
HY26
Organic
Growth
Volumes
279 615
(1 489
)
-
2 286
280 412
0.8
%
Revenue
28 632
(106
)
1 783
1 618
31 927
5.7
%
Cost of sales
(12 602
)
72
(726
)
(446
)
(13 702
)
(3.6
)%
Gross profit
16 029
(34
)
1 058
1 173
18 225
7.4
%
SG&A
(8 812
)
(48
)
(486
)
(572
)
(9 917
)
(6.5
)%
Other operating income/(expenses)
383
(10
)
32
(35
)
369
(9.7
)%
Normalized EBIT
7 601
(92
)
603
566
8 677
7.6
%
Normalized EBITDA
10 156
(103
)
766
557
11 375
5.6
%
Normalized EBITDA margin
35.5
%
35.6
%
(5)bps
North America
HY25
Scope
Currency
Translation
Organic
Growth
HY26
Organic
Growth
Volumes
42 218
121
-
(779
)
41 561
(1.8
)%
Revenue
7 208
59
27
131
7 424
1.8
%
Cost of sales
(2 947
)
(7
)
(9
)
30
(2 932
)
1.0
%
Gross profit
4 261
53
18
161
4 492
3.8
%
SG&A
(2 174
)
(35
)
(10
)
(108
)
(2 328
)
(5.0
)%
Other operating income/(expenses)
23
(0
)
(1
)
(4
)
18
(18.5
)%
Normalized EBIT
2 110
18
7
48
2 183
2.3
%
Normalized EBITDA
2 459
25
8
14
2 505
0.6
%
Normalized EBITDA margin
34.1
%
33.7
%
(43)bps
Middle Americas
HY25
Scope
Currency
Translation
Organic
Growth
HY26
Organic
Growth
Volumes
73 903
(1 362
)
-
3 439
75 979
4.7
%
Revenue
8 124
(155
)
858
768
9 595
9.6
%
Cost of sales
(2 866
)
83
(283
)
(193
)
(3 259
)
(6.9
)%
Gross profit
5 258
(72
)
575
575
6 337
11.1
%
SG&A
(1 898
)
26
(201
)
(167
)
(2 241
)
(8.9
)%
Other operating income/(expenses)
14
0
(0
)
(22
)
(7
)
-
Normalized EBIT
3 374
(46
)
374
387
4 088
11.6
%
Normalized EBITDA
4 007
(44
)
435
369
4 767
9.3
%
Normalized EBITDA margin
49.3
%
49.7
%
(15)bps
South America
HY25
Scope
Currency
Translation
Organic
Growth
HY26
Organic
Growth
Volumes
75 089
-
-
341
75 430
0.5
%
Revenue
5 507
8
428
458
6 402
8.3
%
Cost of sales
(2 764
)
(17
)
(198
)
(140
)
(3 119
)
(5.1
)%
Gross profit
2 743
(9
)
230
318
3 282
11.6
%
SG&A
(1 712
)
(8
)
(114
)
(134
)
(1 968
)
(7.8
)%
Other operating income/(expenses)
201
(2
)
26
29
255
15.3
%
Normalized EBIT
1 233
(19
)
142
213
1 568
17.6
%
Normalized EBITDA
1 699
(9
)
174
212
2 076
12.5
%
Normalized EBITDA margin
30.9
%
32.4
%
120bps
EMEA
HY25
Scope
Currency
Translation
Organic
Growth
HY26
Organic
Growth
Volumes
44 924
(230
)
-
476
45 169
1.1
%
Revenue
4 454
(69
)
397
169
4 951
3.8
%
Cost of sales
(2 280
)
38
(202
)
(29
)
(2 473
)
(1.3
)%
Gross profit
2 174
(31
)
195
139
2 478
6.5
%
SG&A
(1 371
)
(11
)
(121
)
(78
)
(1 581
)
(5.7
)%
Other operating income/(expenses)
101
(8
)
4
(23
)
73
(25.1
)%
Normalized EBIT
904
(50
)
79
38
970
4.4
%
Normalized EBITDA
1 424
(41
)
127
37
1 546
2.7
%
Normalized EBITDA margin
32.0
%
31.2
%
(36)bps
Asia Pacific
HY25
Scope
Currency
Translation
Organic
Growth
HY26
Organic
Growth
Volumes
43 365
(39
)
-
(1 192
)
42 134
(2.8
)%
Revenue
3 108
10
70
(66
)
3 122
(2.1
)%
Cost of sales
(1 456
)
2
(28
)
41
(1 441
)
2.8
%
Gross profit
1 652
12
42
(25
)
1 681
(1.5
)%
SG&A
(941
)
(12
)
(20
)
(42
)
(1 015
)
(4.5
)%
Other operating income/(expenses)
41
(1
)
1
(14
)
27
(35.6
)%
Normalized EBIT
752
(1
)
24
(82
)
693
(10.9
)%
Normalized EBITDA
1 056
7
34
(107
)
990
(10.0
)%
Normalized EBITDA margin
34.0
%
31.7
%
(277)bps
Global Export and Holding Companies
HY25
Scope
Currency
Translation
Organic
Growth
HY26
Organic
Growth
Volumes
116
22
-
1
139
0.8
%
Revenue
231
40
3
159
433
68.0
%
Cost of sales
(290
)
(27
)
(6
)
(155
)
(477
)
(53.0
)%
Gross profit
(59
)
13
(3
)
4
(45
)
7.5
%
SG&A
(716
)
(7
)
(20
)
(42
)
(784
)
(5.8
)%
Other operating income/(expenses)
2
0
1
(0
)
3
(19.0
)%
Normalized EBIT
(773
)
7
(21
)
(38
)
(826
)
(4.9
)%
Normalized EBITDA
(489
)
(40
)
(11
)
32
(508
)
6.0
%
Annex 3: Consolidated statement of financial position
Million US dollar
31 December 2025
30 June 2026
.
ASSETS
Non-current assets
Property, plant and equipment
23 664
22 998
Goodwill
117 908
119 946
Intangible assets
41 985
42 274
Investments in associates
5 002
5 061
Investment securities
161
166
Deferred tax assets
2 708
2 766
Pensions and similar obligations
150
154
Income tax receivables
444
440
Derivatives
145
313
Trade and other receivables
1 871
2 026
Total non-current assets
194 039
196 143
Current assets
Investment securities
306
353
Inventories
5 107
5 528
Income tax receivables
785
622
Derivatives
583
629
Trade and other receivables
6 161
7 404
Cash and cash equivalents
11 638
7 658
Assets classified as held for sale
190
48
Total current assets
24 769
22 242
Total assets
218 808
218 385
EQUITY AND LIABILITIES
Equity
Issued capital
1 736
1 736
Share premium
17 620
17 620
Reserves
17 803
22 458
Retained earnings
50 128
51 686
Equity attributable to equity holders of AB InBev
87 287
93 500
Non-controlling interests
10 449
7 685
Total equity
97 736
101 185
Non-current liabilities
Interest-bearing loans and borrowings
72 128
68 908
Pensions and similar obligations
1 275
1 262
Deferred tax liabilities
11 400
11 565
Income tax payables
206
186
Derivatives
293
391
Trade and other payables
869
1 028
Provisions
425
384
Total non-current liabilities
86 596
83 724
Current liabilities
Bank overdrafts
14
29
Interest-bearing loans and borrowings
885
3 381
Income tax payables
1 825
1 235
Derivatives
6 104
4 021
Trade and other payables
25 455
24 605
Provisions
192
205
Total current liabilities
34 475
33 476
Total equity and liabilities
218 808
218 385
Annex 4: Consolidated statement of cash flows
For the six-month period ended 30 June
Million US dollar
2025
2026
OPERATING ACTIVITIES
Profit of the period
4 568
7 061
Depreciation, amortization and impairment
2 581
2 757
Net finance (income)/expense
1 678
74
Equity-settled share-based payment expense
309
270
Income tax expense
1 404
1 704
Share of results of associates
(144
)
(148
)
Other non-cash items
(93
)
(199
)
Cash flow from operating activities before changes in working capital and use of provisions
10 304
11 520
Decrease/(increase) in trade and other receivables
(1 130
)
(1 077
)
Decrease/(increase) in inventories
(242
)
(370
)
Increase/(decrease) in trade and other payables
(2 284
)
(909
)
Pension contributions and use of provisions
(278
)
(158
)
Cash generated from operations
6 370
9 007
Interest paid
(1 916
)
(1 910
)
Interest received
241
243
Dividends received
135
101
Income tax paid
(2 126
)
(2 200
)
Cash flow from/(used in) operating activities
2 704
5 241
INVESTING ACTIVITIES
Acquisition of property, plant and equipment and of intangible assets
(1 404
)
(1 406
)
Proceeds from sale of property, plant and equipment and of intangible assets
55
46
Sale/(acquisition) and others related to subsidiaries, net of cash
(4
)
(757
)
Proceeds from sale/(acquisition) of other assets
47
310
Cash flow from/(used in) investing activities
(1 306
)
(1 807
)
FINANCING ACTIVITIES
Proceeds from borrowings
4 067
555
Repayments of borrowings
(3 998
)
(309
)
Dividends paid
(3 147
)
(2 596
)
Share buyback
(1 901
)
(1 301
)
Payment of lease liabilities
(354
)
(364
)
Derivative financial instruments
114
(319
)
Sale/(acquisition) of non-controlling interests
(314
)
(3 389
)
Other financing cash flows
(303
)
219
Cash flow from/(used in) financing activities
(5 837
)
(7 505
)
Net increase/(decrease) in cash and cash equivalents
(4 438
)
(4 071
)
Cash and cash equivalents less bank overdrafts at beginning of year
11 174
11 623
Effect of exchange rate fluctuations
410
76
Cash and cash equivalents less bank overdrafts at end of period
7 146
7 629