
SoFi Reports Second Quarter 2026 with Record Net Revenue of $1.2 Billion, Record Member and Product Growth, Net Income of $157 Million
 SAN FRANCISCO--( BUSINESS WIRE)--SoFi Technologies, Inc. (NASDAQ: SOFI), a member-centric, everything app for digital financial services that helps members borrow, save, spend, invest and protect their money, reported financial results today for its second quarter ended June 30, 2026.
“2026 is shaping up to be a defining year, and our second quarter results mark a clear inflection point for SoFi,” said Anthony Noto, CEO of SoFi. “Despite continued market uncertainty, our business model continues to prove its durability. We grew members 35% year-over-year and added a record 2.2 million products, a 42% increase. For the first time, we added twice as many products as members, a major milestone that underscores the trust members place in SoFi and the power of our 'everything app'. Products like SoFi Plus and SoFi Coach are deepening member relationships and increasing lifetime value, while continued innovation across our consumer and enterprise platforms is expanding the value we deliver to members and clients.”
Consolidated Results Summary
Three Months Ended
June 30,
% Change
Six Months Ended
June 30,
% Change
($ in thousands, except per share amounts)
2026
2025
2026
2025
Consolidated – GAAP
Total net revenue
$
1,218,676
$
854,944
43
%
$
2,319,044
$
1,626,703
43
%
Net income
156,592
97,263
61
%
323,323
168,379
92
%
Net income attributable to common stockholders – diluted
156,645
97,614
60
%
323,720
169,069
91
%
Earnings per share attributable to common stockholders – diluted
$
0.12
$
0.08
50
%
$
0.24
$
0.14
71
%
Consolidated – Non-GAAP (1)
Adjusted net revenue
$
1,205,550
$
858,230
40
%
$
2,292,782
$
1,628,950
41
%
Adjusted EBITDA
357,821
249,083
44
%
697,722
459,420
52
%
Adjusted net income
160,406
97,263
65
%
327,137
168,379
94
%
Adjusted net income attributable to common stockholders – diluted
160,459
97,614
64
%
327,534
169,069
94
%
Adjusted earnings per share – diluted
$
0.12
$
0.08
50
%
$
0.24
$
0.15
60
%
(1)
For more information and reconciliations of these non-GAAP measures to the most comparable GAAP measures, see “Non-GAAP Financial Measures” and Table 2 to the “Financial Tables” herein.
Product Highlights
Consolidated Results
SoFi reported a number of record financial achievements. For the second quarter of 2026, record GAAP net revenue of $1.2 billion increased 43% relative to the prior-year period's $854.9 million. Record adjusted net revenue of $1.2 billion grew 40% from the corresponding prior-year period of $858.2 million.
For the second quarter of 2026, total fee-based revenue reached $472.3 million, representing 39% of total revenue in the quarter and increasing 22% from prior quarter. This was driven by strong contributions from origination fees, SoFi Tech Solutions revenue, strong performance from our Loan Platform Business, interchange revenue, and brokerage fee revenue. Together, the Financial Services and Technology Platform segments generated $550.8 million of net revenue, an increase of 17% from the prior year period.
Net interest income of $788.2 million for the second quarter was up 52% year-over-year. This was driven by a 49% increase in average interest-earning assets and a 36 basis point decrease in cost of funds, partially offset by a 32 basis point decrease in average asset yields year-over-year. For the second quarter, net interest margin of 5.98% increased 4 basis points from the prior quarter.
During the quarter, average total deposits comprised over 90% of average total liabilities. The average rate paid on deposits in the second quarter was 156 basis points lower than that paid on warehouse facilities, which translates to approximately $712.6 million of annualized interest expense savings due to the successful remixing of our funding base.
Second quarter record adjusted EBITDA of $357.8 million increased 44% from the prior year period's $249.1 million. This represents an adjusted EBITDA margin of 30%.
For the second quarter of 2026, GAAP net income reached $156.6 million and diluted earnings per share reached $0.12.
Equity grew by $264.6 million during the quarter to $11.1 billion and $8.58 of book value per share. Tangible book value grew by $225.8 million during the quarter, ending the period at $9.5 billion. Tangible book value per share was $7.34 at quarter-end, up from $4.72 per share in the prior year period, and up 56% year-over-year.
Member and Product Growth
Continued growth in both total members and products in the second quarter is the result of our continued investments in innovation and brand building and reflects the benefits of our broad product suite and unique Financial Services Productivity Loop (FSPL) strategy.
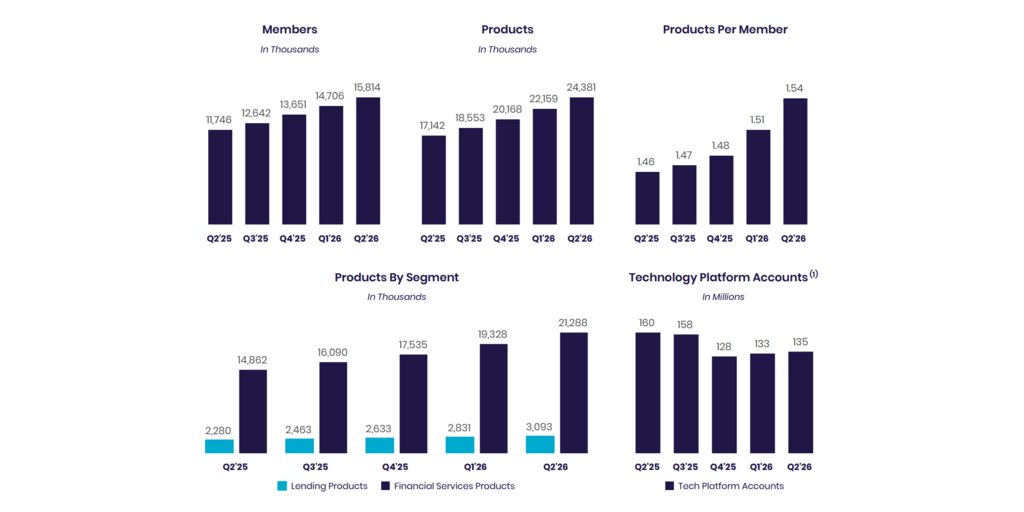
SoFi added a record 1.1 million members in the second quarter of 2026, bringing total members to 15.8 million, up 35% from 11.7 million at the end of the same prior year period.
SoFi also achieved record product additions of 2.2 million in the second quarter of 2026, bringing total products to nearly 24.4 million, up 42% from 17.1 million at the end of the same prior year period.
Financial Services products increased by 43% year-over-year to 21.3 million, primarily driven by continued demand for our SoFi Money, Relay and Invest products, and drove 89% of our total product growth. Financial Services products account for 87% of total products.
Lending products increased by 36% year-over-year to 3.1 million, driven by continued demand for personal, student, and home loan products.
Technology Platform-enabled accounts decreased 16% year-over-year to 135 million, including the impact from a large client which fully transitioned off the platform prior to December 31, 2025. Technology Platform-enabled accounts increased 2 million from the prior quarter.
Financial Services Segment Results
For the second quarter of 2026, Financial Services segment net revenue of $466.3 million increased 29% from the prior year period. Noninterest income of $217.2 million increased 28% year-over-year. Net interest income of $249.1 million increased 29% year-over-year, primarily driven by growth in consumer deposits.
In the second quarter, SoFi's Loan Platform Business added $143.3 million to our consolidated adjusted net revenue. Of this, $140.9 million was driven by $3.1 billion of personal loans originated on behalf of third parties as well as referrals to third parties. During the second quarter, SoFi expanded its Loan Platform Business offering to include SMB Loans while also reaching an agreement with a new partner to invest in personal loans. Subsequent to quarter-end, SoFi further expanded its LPB offering to include Home Equity Loans.
In addition to our Loan Platform Business, SoFi continued to see healthy growth in interchange fee revenue and brokerage fee revenue. In the second quarter, interchange fee revenue was up 55% year-over-year, as a result of $28 billion in total annualized spend in the quarter across SoFi Money and Credit Card. Brokerage fee revenue was up nearly 2.5x year-over-year, reflecting strong member demand and increased monetization.
Contribution profit for the second quarter of 2026 reached $212.7 million, a $24.4 million improvement over the prior year period, while contribution margin declined 6 percentage points year-over-year to 46%.
Financial Services – Segment Results of Operations
Three Months Ended
June 30,
Six Months Ended
June 30,
($ in thousands)
2026
2025
% Change
2026
2025
% Change
Net interest income
$
249,052
$
193,322
29
%
$
476,792
$
366,521
30
%
Noninterest income
217,226
169,211
28
%
418,029
299,131
40
%
Total net revenue – Financial Services
466,278
362,533
29
%
894,821
665,652
34
%
Provision for credit losses
(13,756
)
(10,031
)
37
%
(22,646
)
(15,670
)
45
%
Directly attributable expenses
(239,846
)
(164,270
)
46
%
(463,915
)
(313,418
)
48
%
Contribution profit – Financial Services
$
212,676
$
188,232
13
%
$
408,260
$
336,564
21
%
Contribution margin – Financial Services (1)
46
%
52
%
46
%
51
%
(1)
Contribution margin is defined for each of our reportable segments as contribution profit divided by net revenue.
By continuously innovating with new and relevant offerings, features and rewards for members, SoFi grew total Financial Services products by 6.4 million, or 43%, year-over-year, bringing the total to 21.3 million at quarter-end. SoFi Money reached 7.9 million products, Relay reached 8.0 million products, SoFi Invest reached 3.9 million products, Crypto reached 388 thousand products and SoFi Plus reached 206 thousand products by the end of the second quarter.
In the second quarter of 2026, total deposits grew $5.3 billion to $45.5 billion, which included strong growth in member deposits.
Financial Services – Products
June 30,
2026
2025
% Change
Money (1)
7,888,387
5,887,669
34
%
Invest (2)
3,931,718
2,853,416
38
%
Credit Card (3)
509,825
344,469
48
%
Referred loans (4)
180,443
122,580
47
%
Crypto (5)
388,336
—
n/m
SoFi Plus (3)
206,000
—
n/m
At Work
189,078
127,224
49
%
Relay
7,993,828
5,526,315
45
%
Total financial services products
21,287,615
14,861,673
43
%
(1)
Includes checking and savings accounts held at SoFi Bank, and cash management accounts.
(2)
Beginning in the first quarter of 2026, we updated our SoFi Invest product metric to reflect four products. Prior to this, our SoFi Invest service was composed of two products, self-directed accounts and robo-advisory accounts. Self-directed accounts were previously referred to as active investing accounts. The impact to prior periods was determined to be immaterial, and prior periods were not recast.
(3)
Beginning in the second quarter of 2026, we updated our Financial Services products to include (i) SoFi Plus, which we relaunched during the quarter with significantly enhanced benefits, while fully transitioning the product to a paid subscription model; and (ii) Smart Card, our recently launched secured card (presented above within Credit Card). The impact to prior periods was determined to be immaterial, and prior periods were not recast.
(4)
Limited to loans wherein we provide third party fulfillment services as part of our Loan Platform Business.
(5)
During the fourth quarter of 2025, we returned to crypto investing with the launch of SoFi Crypto.
Technology Platform Segment Results
Technology Platform segment net revenue of $84.5 million for the second quarter of 2026 increased 13% from the prior quarter. Compared to the prior year period, segment revenue decreased 23%. This includes the impact from a large client which fully transitioned off the platform prior to December 31, 2025. Contribution profit of $11.8 million reflected a contribution margin of 14%.
Technology Platform – Segment Results of Operations
Three Months Ended
June 30,
Six Months Ended
June 30,
($ in thousands)
2026
2025
% Change
2026
2025
% Change
Net interest income
$
1,022
$
266
284
%
$
1,377
$
679
103
%
Noninterest income
83,483
109,567
(24
)%
158,214
212,581
(26
)%
Total net revenue – Technology Platform
84,505
109,833
(23
)%
159,591
213,260
(25
)%
Directly attributable expenses
(72,733
)
(76,638
)
(5
)%
(135,820
)
(149,152
)
(9
)%
Contribution profit
$
11,772
$
33,195
(65
)%
$
23,771
$
64,108
(63
)%
Contribution margin – Technology Platform (1)
14
%
30
%
15
%
30
%
(1)
Contribution margin is defined for each of our reportable segments as contribution profit divided by net revenue.
Technology Platform enabled accounts increased 2 million from the prior quarter. Technology Platform-enabled accounts decreased 16% year-over-year to 135 million.
During the second quarter, SoFi launched a new unified brand, SoFi Tech Solutions, offering enterprise clients products and services across one integrated platform serving four key areas: Processing, Banking Core Ledgers & Services, Payment Hub, and Risk & Fraud. SoFi also added new platform capabilities across credit cards, lines of credit, buy now, pay later, and installment lending.
Technology Platform
June 30,
2026
2025
% Change
Total accounts
134,804,238
160,046,369
(16
)%
Lending Segment Results
For the second quarter of 2026, Lending segment GAAP net revenue of $724.8 million increased 63% from the prior year period, while adjusted net revenue for the segment of $711.7 million increased 59% from the prior year period.
Lending segment performance in the second quarter was driven by net interest income, which rose 54% year-over-year. The balance of the growth was primarily driven from loan origination fees which increased 64% from the prior year.
Lending segment second quarter contribution profit of $399.0 million was up 63% from $244.7 million in the corresponding prior-year period. Lending segment adjusted contribution margin was strong at 56%. This strong performance reflects our ability to capitalize on continued strong demand for our lending products.
Lending – Segment Results of Operations
Three Months Ended
June 30,
Six Months Ended
June 30,
($ in thousands)
2026
2025
% Change
2026
2025
% Change
Net interest income
$
573,298
$
372,675
54
%
$
1,073,529
$
733,296
46
%
Noninterest income
151,500
70,837
114
%
293,689
123,589
138
%
Total net revenue – Lending
724,798
443,512
63
%
1,367,218
856,885
60
%
Servicing rights – change in valuation inputs or assumptions
(13,142
)
3,274
n/m
(26,305
)
2,200
n/m
Residual interests classified as debt – change in valuation inputs or assumptions
16
12
33
%
43
47
(9
)%
Directly attributable expenses
(312,639
)
(202,088
)
55
%
(559,537
)
(375,487
)
49
%
Contribution profit – Lending
$
399,033
$
244,710
63
%
$
781,419
$
483,645
62
%
Contribution margin – Lending (1)
55
%
55
%
57
%
56
%
Adjusted net revenue – Lending (non-GAAP) (2)
$
711,672
$
446,798
59
%
$
1,340,956
$
859,132
56
%
Adjusted contribution margin – Lending (non-GAAP) (2)
56
%
55
%
58
%
56
%
(1)
Contribution margin is defined for each of our reportable segments as contribution profit divided by net revenue.
(2)
For more information and a reconciliation of these non-GAAP financial measures to the most comparable GAAP measure, see “Non-GAAP Financial Measures” and Table 2 to the “Financial Tables” herein.
Lending – Loans At Fair Value
($ in thousands)
Personal Loans
Student Loans
Home Loans
Total
June 30, 2026
Unpaid principal
$
26,101,759
$
16,134,415
$
2,067,122
$
44,303,296
Accumulated interest
180,704
81,501
9,450
271,655
Cumulative fair value adjustments (1)
1,222,827
704,648
99,586
2,027,061
Total fair value of loans (2)(3)
$
27,505,290
$
16,920,564
$
2,176,158
$
46,602,012
March 31, 2026
Unpaid principal
$
22,317,947
$
14,510,630
$
1,562,339
$
38,390,916
Accumulated interest
161,450
69,285
6,945
237,680
Cumulative fair value adjustments (1)
1,203,024
756,905
78,724
2,038,653
Total fair value of loans (2)(3)
$
23,682,421
$
15,336,820
$
1,648,008
$
40,667,249
(1)
During the three months ended June 30, 2026, the cumulative fair value adjustments for personal loans were impacted by a higher unpaid principal balance, offset by a higher weighted average conditional prepayment rate, a higher weighted average discount rate, lower weighted average coupon, and a higher weighted average annual default rate. The higher discount rate was primarily driven by a 37 basis point increase in benchmark rates. The cumulative fair value adjustments for student loans were impacted by a higher unpaid principal balance and a lower weighted average conditional prepayment rate, partially offset by a lower weighted average coupon, higher weighted average discount rate, and higher weighted average default rate.
(2)
Each component of the fair value of loans is impacted by charge-offs during the period. Our fair value assumption for annual default rate incorporates fair value markdowns on loans beginning when they are 10 days or more delinquent, with additional markdowns at 30, 60 and 90 days past due.
(3)
Student loans are classified as loans held for investment, and personal loans and home loans are classified as loans held for sale.
The following table summarizes the significant inputs to the fair value model for personal and student loans:
Personal Loans
Student Loans
June 30, 2026
March 31, 2026
June 30, 2026
March 31, 2026
Weighted average coupon rate (1)
12.89
%
12.96
%
5.89
%
5.91
%
Weighted average annual default rate
4.77
%
4.57
%
0.73
%
0.69
%
Weighted average conditional prepayment rate
25.77
%
25.55
%
10.99
%
11.15
%
Weighted average discount rate
4.97
%
4.61
%
4.29
%
4.05
%
Benchmark rate (2)
3.99
%
3.62
%
3.90
%
3.59
%
(1)
Represents the average coupon rate on loans held on balance sheet, weighted by unpaid principal balance outstanding at the balance sheet date.
(2)
Corresponds with two-year SOFR for personal loans, and four-year SOFR for student loans.
For the second quarter of 2026, record origination volume of $14.8 billion increased 69% year-over-year. This was a result of continued strong member demand for personal loans, student loans and home loans as well as strong demand from capital markets partners.
Record personal loan originations of $10.7 billion in the second quarter of 2026 were up 54% year-over-year, inclusive of $3.1 billion originated on behalf of third parties through our Loan Platform Business. SoFi's multichannel strategy continues to allow us to serve more members and provide revenue diversification.
Second quarter student loan volume of $2.7 billion was up 170% year-over-year. This marked the highest quarter of student loan originations in SoFi's history.
Home loan volume was $1.4 billion, an increase of 74% year-over-year. Home equity loan originations were strong during the second quarter, accounting for one-third of total home loan volume.
Capital markets activity in the second quarter of 2026 was strong. Overall, SoFi sold, or transferred through our Loan Platform Business, more than $4.1 billion in total of personal loans and home loans. In terms of home loan sales, we closed $833.7 million at a blended execution of 101.6%.
During the quarter, SoFi executed two co-contributor securitizations of loans previously originated through our Loan Platform Business, totaling $1.4 billion. These marked the sixth and seventh securitizations of new collateral under our SoFi Consumer Loan Program (SCLP) since 2021 using collateral originated in the Loan Platform Business. Importantly, this channel provides our partners with meaningful liquidity to support their ongoing investment in the Loan Platform Business. The transaction priced at industry-leading cost-of-funds levels, with a weighted average spread of 91 basis points and 86 basis points, respectively.
Credit performance for personal loans remained strong in the second quarter, in line with expectations. Excluding the impact of late stage delinquent loan sales, it is estimated that, including recoveries, the all-in annualized net charge-off rate for personal loans would have been approximately 3.7%, a 70 basis point improvement from the prior quarter and an 80 basis point improvement from the prior year period, driven by an improvement in the underlying performance as well as strong growth in average loans.
The personal loan annualized charge-off rate decreased 21 basis points year-over-year to 2.62%, which includes the impact of asset sales, new originations and delinquency sales in the quarter. The annualized charge-off rate decreased from 3.03% in the prior quarter. The student loan annualized charge-off rate decreased to 61 basis points from 65 basis points in the prior quarter.
The on-balance sheet 90-day delinquency rates for both personal loans and student loans were consistent with the prior year.
The data continues to support a 7–8% maximum cumulative net loss assumption for personal loans, in line with SoFi's underwriting tolerance.
Recent vintages, originated from the fourth quarter of 2022 to third quarter of 2025 have net cumulative losses of 4.68%, with 35% unpaid principal balance remaining. This is well below the 6.43% observed at the same point in time for the 2017 vintage which is the last vintage that approached our 7-8% tolerance. The gap between the newer cohort curve and the 2017 cohort curve improved by 15 basis points, after improving 9 basis points last quarter, demonstrating continued improvement.
Additionally, of the first quarter of 2020 through the first quarter of 2026 originations, 62% of principal has already been paid down, with 6.8% in net cumulative losses. Therefore, for life-of-loan losses on this entire cohort of loans to reach 8%, the charge-off rate on the remaining 38% of unpaid principal would need to be approximately 10%. This would be well above past levels, providing us further confidence in achieving loss rates below our 8% tolerance.
Lending – Originations and Average Balances
Three Months Ended
June 30,
% Change
Six Months Ended
June 30,
% Change
2026
2025
2026
2025
Origination volume ($ in thousands, during period)
Personal loans (1)
$
10,718,359
$
6,968,746
54
%
$
19,058,608
$
12,505,587
52
%
Student loans
2,686,760
993,326
170
%
5,300,468
2,184,789
143
%
Home loans
1,393,375
798,881
74
%
2,618,049
1,316,639
99
%
Total
$
14,798,494
$
8,760,953
69
%
$
26,977,125
$
16,007,015
69
%
Average loan balance ($, as of period end) (2)
Personal loans
$
25,361
$
25,758
(2
)%
Student loans
45,905
43,209
6
%
Home loans
232,271
270,540
(14
)%
(1)
Inclusive of origination volume related to our Loan Platform Business.
(2)
Within each loan product category, average loan balance is defined as the total unpaid principal balance of the loans divided by the number of loans that have a balance greater than zero dollars as of the reporting date. Average loan balance includes loans on our balance sheet, as well as transferred loans and referred loans with which SoFi has continuing involvement through our servicing agreements.
Lending – Products
June 30,
2026
2025
% Change
Personal loans (1)
2,325,262
1,641,340
42
%
Student loans
703,081
596,351
18
%
Home loans
65,016
42,677
52
%
Total lending products
3,093,359
2,280,368
36
%
(1)
Includes loans which we originate as part of our Loan Platform Business.
Guidance and Outlook
For the full year, management increases its revenue outlook. Management now expects to deliver adjusted net revenue of approximately $4.75 billion to $4.85 billion which implies approximately 32% to 35% annual adjusted net revenue growth year-over-year. Management continues to expect adjusted EBITDA of approximately $1.6 billion, which equates to an annual adjusted EBITDA margin of approximately 33% to 34%. Management also continues to expect adjusted net income of approximately $825 million, which equates to a margin of approximately 17%, and adjusted EPS of approximately 60 cents per share. This assumes an effective tax rate of approximately 22% for the full year 2026.
For 2026, management continues to expect to increase total members by at least 30% year-over-year.
Management will further address guidance on the quarterly earnings conference call. Management has not reconciled forward-looking non-GAAP measures to their most directly comparable GAAP measures. This is because the company cannot predict with reasonable certainty and without unreasonable efforts the ultimate outcome of certain GAAP components of such reconciliations due to market-related assumptions that are not within our control as well as certain legal or advisory costs, tax costs or other costs that may arise. For these reasons, management is unable to assess the probable significance of the unavailable information, which could materially impact the amount of the future directly comparable GAAP measures.
Earnings Webcast
SoFi’s executive management team will host a live audio webcast beginning at 8:00 a.m. Eastern Time (5:00 a.m. Pacific Time) today to discuss the quarter’s financial results and business highlights. All interested parties are invited to listen to the live webcast at https://investors.sofi.com. A replay of the webcast will be available on the SoFi Investor Relations website for 30 days. Investor information, including supplemental financial information, is available on SoFi’s Investor Relations website at https://investors.sofi.com.
Cautionary Statement Regarding Forward-Looking Statements
Certain of the statements above are forward-looking and as such are not historical facts. This includes, without limitation, statements regarding our expectations for the full year 2026 adjusted net revenue, annual growth rate, adjusted EBITDA, adjusted EBITDA margin, adjusted net income, adjusted EPS, and new members, our expectations regarding launching a unified brand across our technology platform businesses, our expectations regarding the revenue diversification benefits of our multichannel personal loan origination and sale strategy, our expectations regarding our ability to continue to grow our business, deliver superior financial returns, build our brand and launch new business lines and products, our ability to continue to drive momentum, deepen member engagement, and increase cross-buy, our expectations regarding the size of our market opportunity, our ability to continue to attract and execute deals, our ability to continue to improve our financials and increase our member, product and total accounts count, our ability to achieve diversified and more durable growth, including our ability to continue to grow our Loan Platform Business, our ability to continue the momentum seen in prior financial periods, our ability to have loss rates below 8%, our ability to navigate the macroeconomic, geopolitical and regulatory environment, any changes in demand for our products, and the financial position, business strategy and plans and objectives of management for our future operations. These forward-looking statements are not guarantees of performance. Such statements can be identified by the fact that they do not relate strictly to historical or current facts. Words such as “achieve”, “believe”, “continue”, “expect”, “capable”, “future”, “growth”, “may”, “opportunity”, “plan”, “potential”, “strategy”, “will be”, “will continue”, and similar expressions may identify forward-looking statements, but the absence of these words does not mean that a statement is not forward-looking. Factors that could cause actual results to differ materially from those contemplated by these forward-looking statements include: (i) the effect of and our ability to respond and adapt to changing market and economic conditions, including economic downturns, fluctuating inflation and interest rates, and volatility from macroeconomic, global, and political events, including announced or planned tariffs; (ii) our ability to maintain net income profitability, continue to increase fee-based revenue streams, continue to grow across our segments in the future, as well as our ability to meet our guidance; (iii) the impact on our business of the regulatory environment, changes in governmental policies, changes in personnel and resources of the governmental agencies that regulate us, and complexities with compliance related to such environment; (iv) our ability to realize the benefits of being a bank holding company and operating SoFi Bank, including continuing to grow high quality deposits and our rewards program for members; (v) our ability to continue to drive brand awareness and realize the benefits of our marketing and advertising campaigns; (vi) our ability to vertically integrate our businesses and accelerate the pace of innovation of our financial products; (vii) our ability to manage our growth effectively; (viii) our ability to access sources of capital on acceptable terms or at all; (ix) the success of our continued investments in our business; (x) our ability to expand our member base, increase our product adds and increase cross-buy; (xi) our ability to maintain our leadership position in certain categories of our business and to grow market share in existing markets or any new markets we may enter; (xii) our ability to cater to a broad range of clients and continue to execute deals with current or future business partners; (xiii) our ability to develop new products, features and functionality that are competitive and meet market needs; (xiv) our ability to realize the benefits of our strategy, including what we refer to as our FSPL; (xv) our ability to make accurate credit and pricing decisions or effectively forecast our loss rates; (xvi) our ability to establish and maintain an effective system of internal controls over financial reporting; (xvii) our ability to maintain the security and reliability of our products; and (xviii) the outcome of any legal or governmental proceedings instituted against us. The foregoing list of factors is not exhaustive. You should carefully consider the foregoing factors and the other risks and uncertainties set forth in the section titled “Risk Factors” in our last annual report on Form 10-K, as filed with the Securities and Exchange Commission, and those that are included in any of our future filings with the Securities and Exchange Commission. These forward-looking statements are based on information available as of the date hereof and current expectations, forecasts and assumptions, and involve a number of judgments, risks and uncertainties. Accordingly, forward-looking statements should not be relied upon as representing our views as of any subsequent date, and we do not undertake any obligation to update forward-looking statements to reflect events or circumstances after the date they were made, whether as a result of new information, future events or otherwise, except as may be required under applicable securities laws.
As a result of a number of known and unknown risks and uncertainties, our actual results or performance may be materially different from those expressed or implied by these forward-looking statements. You should not place undue reliance on these forward-looking statements.
Non-GAAP Financial Measures
This press release presents information about certain non-GAAP financial measures provided as supplements to the results provided in accordance with accounting principles generally accepted in the United States (GAAP). Our management and Board of Directors uses these non-GAAP measures to evaluate our operating performance, formulate business plans, help better assess our overall liquidity position, and make strategic decisions, including those relating to operating expenses and the allocation of internal resources. Accordingly, we believe that these non-GAAP measures provide useful information to investors and others in understanding and evaluating our operating results in the same manner as our management and Board of Directors. These non-GAAP measures have limitations as analytical tools, and should not be considered in isolation from, or as a substitute for, the analysis of other GAAP financial measures. Other companies may not use these non-GAAP measures or may use similar measures that are defined in a different manner. Therefore, SoFi's non-GAAP measures may not be directly comparable to similarly titled measures of other companies.
Reconciliations of these non-GAAP measures to the most directly comparable GAAP financial measures are provided in Table 2 to the “Financial Tables” herein.
About SoFi
SoFi Technologies (NASDAQ: SOFI) is the everything app for digital financial services on a mission to help people achieve financial independence to realize their ambitions. 15.8 million members trust SoFi to borrow, save, spend, invest, and protect their money and buy, sell and hold their crypto – all in one app – and get access to financial planners, exclusive experiences, and a thriving community. Banks, fintechs, and brands use innovative capabilities from SoFi Tech Solutions to serve over 134 million global accounts. For more information, visit www.sofi.com or download our iOS and Android apps.
Availability of Other Information About SoFi
Investors and others should note that we communicate with our investors and the public using our website ( https://www.sofi.com), the investor relations website ( https://investors.sofi.com), and on social media (X and LinkedIn), including but not limited to investor presentations and investor fact sheets, Securities and Exchange Commission filings, press releases, public conference calls and webcasts. The information that SoFi posts on these channels and websites could be deemed to be material information. As a result, SoFi encourages investors, the media, and others interested in SoFi to review the information that is posted on these channels, including the investor relations website, on a regular basis. This list of channels may be updated from time to time on SoFi’s investor relations website and may include additional social media channels. The contents of SoFi’s website or these channels, or any other website that may be accessed from its website or these channels, shall not be deemed incorporated by reference in any filing under the Securities Act of 1933, as amended.
SOFI-F
FINANCIAL TABLES
(Unaudited)
Table 1
SoFi Technologies, Inc.
Condensed Consolidated Statements of Operations and Comprehensive Income
(Unaudited)
(In Thousands, Except for Per Share Data)
Three Months Ended
June 30,
Six Months Ended
June 30,
2026
2025
2026
2025
Interest income
Loans and securitizations
$
1,067,894
$
738,862
$
2,000,078
$
1,451,738
Other
72,634
53,543
141,446
104,479
Total interest income
1,140,528
792,405
2,141,524
1,556,217
Interest expense
Securitizations and warehouses
18,779
29,650
28,830
57,794
Deposits
320,463
233,232
607,692
458,631
Corporate borrowings
10,675
11,504
21,326
22,932
Other
2,416
182
2,493
297
Total interest expense
352,333
274,568
660,341
539,654
Net interest income
788,195
517,837
1,481,183
1,016,563
Noninterest income
Loan origination, sales, securitizations and servicing
150,407
70,855
292,616
123,660
Technology products and solutions
52,459
90,796
101,810
177,233
Loan platform fees
140,930
127,405
279,185
220,155
Crypto transaction revenue
134,267
—
255,860
—
Cost of crypto transaction revenue
(133,084
)
—
(253,825
)
—
Net crypto transaction revenue
1,183
—
2,035
—
Other
85,502
48,051
162,215
89,092
Total noninterest income
430,481
337,107
837,861
610,140
Total net revenue
1,218,676
854,944
2,319,044
1,626,703
Provision for credit losses
13,755
10,035
22,650
15,713
Noninterest expense
Technology and product development
191,276
152,146
378,951
308,352
Sales and marketing
392,397
264,744
727,936
502,920
Cost of operations
200,139
150,437
371,262
285,957
General and administrative
216,800
165,390
414,384
321,787
Total noninterest expense
1,000,612
732,717
1,892,533
1,419,016
Income before income taxes
204,309
112,192
403,861
191,974
Income tax expense
(47,717
)
(14,929
)
(80,538
)
(23,595
)
Net income
$
156,592
$
97,263
$
323,323
$
168,379
Earnings per share
Earnings per share – basic
$
0.12
$
0.09
$
0.25
$
0.15
Earnings per share – diluted
$
0.12
$
0.08
$
0.24
$
0.14
Weighted average common stock outstanding – basic
1,284,303
1,107,006
1,280,338
1,102,525
Weighted average common stock outstanding – diluted
1,351,990
1,182,877
1,364,978
1,184,197
Table 2
Non-GAAP Financial Measures
(Unaudited)
Adjusted Net Revenue
Adjusted net revenue is a non-GAAP measure. Adjusted net revenue is defined as total net revenue, adjusted to exclude the fair value changes in servicing rights and residual interests classified as debt due to valuation inputs and assumptions changes, which relate only to our Lending segment, as well as gains and losses on extinguishment of debt. We adjust total net revenue to exclude these items, as they are non-cash charges that are not realized during the period or not indicative of our core operating performance, and therefore positive or negative changes do not impact the cash available to fund our operations. Management believes this measure is useful because it enables management and investors to assess our underlying operating performance and cash available to fund our operations. In addition, management uses this measure to better decide on the proper expenses to authorize for each of our operating segments, to ultimately help achieve target contribution profit margins.
The following table reconciles adjusted net revenue to total net revenue, the most directly comparable GAAP measure:
Three Months Ended
June 30,
Six Months Ended
June 30,
($ in thousands)
2026
2025
2026
2025
Total net revenue (GAAP)
$
1,218,676
$
854,944
$
2,319,044
$
1,626,703
Servicing rights – change in valuation inputs or assumptions (1)
(13,142
)
3,274
(26,305
)
2,200
Residual interests classified as debt – change in valuation inputs or assumptions (2)
16
12
43
47
Adjusted net revenue (non-GAAP)
$
1,205,550
$
858,230
$
2,292,782
$
1,628,950
(1)
Reflects changes in fair value inputs and assumptions on servicing rights, including conditional prepayment, default rates and discount rates. These assumptions are highly sensitive to market interest rate changes and are not indicative of our performance or results of operations. Moreover, these non-cash charges are unrealized during the period and, therefore, have no impact on our cash flows from operations.
(2)
Reflects changes in fair value inputs and assumptions on residual interests classified as debt, including conditional prepayment, default rates and discount rates. When third parties finance our consolidated securitization VIEs by purchasing residual interests, we receive proceeds at the time of the closing of the securitization and, thereafter, pass along contractual cash flows to the residual interest owner. These residual debt obligations are measured at fair value on a recurring basis, but they have no impact on our initial financing proceeds, our future obligations to the residual interest owner (because future residual interest claims are limited to contractual securitization collateral cash flows), or the general operations of our business.
The following table reconciles adjusted net revenue for the Lending segment to total net revenue, the most directly comparable GAAP measure for the Lending segment:
Three Months Ended
June 30,
Six Months Ended
June 30,
($ in thousands)
2026
2025
2026
2025
Lending
Total net revenue – Lending (GAAP)
$
724,798
$
443,512
$
1,367,218
$
856,885
Servicing rights – change in valuation inputs or assumptions (1)
(13,142
)
3,274
(26,305
)
2,200
Residual interests classified as debt – change in valuation inputs or assumptions (2)
16
12
43
47
Adjusted net revenue – Lending (non-GAAP)
$
711,672
$
446,798
$
1,340,956
$
859,132
(1)
See footnote (1) to the table above.
(2)
See footnote (2) to the table above.
Adjusted Noninterest Income
Adjusted noninterest income is a non-GAAP measure. Adjusted noninterest income is defined as noninterest income, adjusted to exclude the fair value changes in servicing rights and residual interests classified as debt due to valuation inputs and assumptions changes, which relate only to our Lending segment, as well as gains and losses on extinguishment of debt. We adjust noninterest income to exclude these items, as they are non-cash charges that are not realized during the period or not indicative of our core operating performance, and therefore positive or negative changes do not impact the cash available to fund our operations. Management believes this measure is useful because it enables management and investors to assess our underlying operating performance and cash available to fund our operations.
The following table reconciles adjusted noninterest income to noninterest income, the most directly comparable GAAP measure:
Three Months Ended
June 30,
Six Months Ended
June 30,
($ in thousands)
2026
2025
2026
2025
Noninterest income (GAAP)
$
430,481
$
337,107
$
837,861
$
610,140
Servicing rights – change in valuation inputs or assumptions (1)
(13,142
)
3,274
(26,305
)
2,200
Residual interests classified as debt – change in valuation inputs or assumptions (2)
16
12
43
47
Adjusted noninterest income (non-GAAP)
$
417,355
$
340,393
$
811,599
$
612,387
(1)
Reflects changes in fair value inputs and assumptions on servicing rights, including conditional prepayment, default rates and discount rates. These assumptions are highly sensitive to market interest rate changes and are not indicative of our performance or results of operations. Moreover, these non-cash charges are unrealized during the period and, therefore, have no impact on our cash flows from operations.
(2)
Reflects changes in fair value inputs and assumptions on residual interests classified as debt, including conditional prepayment, default rates and discount rates. When third parties finance our consolidated securitization VIEs by purchasing residual interests, we receive proceeds at the time of the closing of the securitization and, thereafter, pass along contractual cash flows to the residual interest owner. These residual debt obligations are measured at fair value on a recurring basis, but they have no impact on our initial financing proceeds, our future obligations to the residual interest owner (because future residual interest claims are limited to contractual securitization collateral cash flows), or the general operations of our business.
The following table reconciles adjusted noninterest income for the Lending segment to noninterest income, the most directly comparable GAAP measure for the Lending segment:
Three Months Ended
June 30,
Six Months Ended
June 30,
($ in thousands)
2026
2025
2026
2025
Lending
Noninterest income – Lending (GAAP)
$
151,500
$
70,837
$
293,689
$
123,589
Servicing rights – change in valuation inputs or assumptions (1)
(13,142
)
3,274
(26,305
)
2,200
Residual interests classified as debt – change in valuation inputs or assumptions (2)
16
12
43
47
Adjusted noninterest income – Lending (non-GAAP)
$
138,374
$
74,123
$
267,427
$
125,836
(1)
See footnote (1) to the table above.
(2)
See footnote (2) to the table above.
Adjusted Contribution Margin and Incremental Adjusted Contribution Margin — Lending
Adjusted contribution margin and incremental adjusted contribution margin are non-GAAP measures and relate only to our Lending segment. Adjusted contribution margin is defined as segment contribution profit for the Lending segment, divided by adjusted net revenue for the Lending segment, a non-GAAP measure. Incremental adjusted contribution margin is defined as the change in segment contribution profit for our Lending segment, divided by change in adjusted net revenue for the Lending segment. See ‘Adjusted Net Revenue’ above for a reconciliation of Lending segment adjusted net revenue.
Management believes adjusted contribution margin metrics are useful because they enable management and investors to assess the underlying operating performance of our Lending segment, by removing the impact of changes in volume over periods to present a comparable view of segment contribution profit, which is a measure of the direct profitability of each of our reportable segments, as a percentage of segment adjusted net revenue for the Lending segment during each period.
The following table presents a reconciliation of adjusted contribution margin and incremental adjusted contribution margin for our reportable Lending segment:
Three Months Ended
June 30,
2026 vs 2025
Six Months Ended
June 30,
2026 vs 2025
($ in thousands)
2026
2025
$ Change
2026
2025
$ Change
Lending
Contribution profit – Lending (GAAP)
$
399,033
$
244,710
$
154,323
$
781,419
$
483,645
$
297,774
Net revenue – Lending (GAAP)
724,798
443,512
281,286
1,367,218
856,885
510,333
Contribution margin – Lending (GAAP) (1)
55
%
55
%
57
%
56
%
Incremental contribution margin – Lending (GAAP) (1)
55
%
58
%
Adjusted net revenue – Lending (non-GAAP) (2)
$
711,672
$
446,798
$
264,874
$
1,340,956
$
859,132
$
481,824
Adjusted contribution margin – Lending (non-GAAP)
56
%
55
%
58
%
56
%
Incremental adjusted contribution margin – Lending (non-GAAP)
58
%
62
%
(1)
Contribution margin is defined for each of our reportable segments as contribution profit divided by net revenue. Incremental contribution margin for each of our reportable segments is defined as the change in segment contribution profit divided by change in net revenue.
(2)
Refer to ‘Adjusted Net Revenue’ above for reconciliation of this non-GAAP measure.
Adjusted EBITDA, Adjusted EBITDA Margin and Incremental Adjusted EBITDA Margin
Adjusted EBITDA, adjusted EBITDA margin and incremental adjusted EBITDA margin are non-GAAP measures. Adjusted EBITDA is defined as net income, adjusted to exclude, as applicable: (i) corporate borrowing-based interest expense (our adjusted EBITDA measure is not adjusted for warehouse or securitization-based interest expense, nor deposit interest expense and finance lease liability interest expense, as these are direct operating expenses), (ii) income tax expense (benefit), (iii) depreciation and amortization, (iv) share-based expense (inclusive of equity-based payments to non-employees), (v) foreign currency impacts related to operations in highly inflationary countries, (vi) fair value changes in each of servicing rights and residual interests classified as debt due to valuation assumptions, (vii) restructuring charges, (viii) transaction-related expenses, and (ix) other charges, as appropriate, that are not expected to recur and are not indicative of our core operating performance.
Adjusted EBITDA margin is computed as adjusted EBITDA divided by adjusted net revenue. Incremental adjusted EBITDA margin is defined as the change in adjusted EBITDA, divided by change in adjusted net revenue. See ‘Adjusted Net Revenue’ above for a reconciliation of this non-GAAP measure.
Management believes adjusted EBITDA, adjusted EBITDA margin and incremental adjusted EBITDA margin are useful measures for period-over-period comparisons of our business. These measures enable management and investors to assess our core operating performance or results of operations by removing the effects of certain non-cash items and charges, as well as the impact of changes in volume over periods as applicable. In addition, management uses these measures to help evaluate cash flows generated from operations and the extent of additional capital, if any, required to invest in strategic initiatives.
The following table reconciles adjusted EBITDA to net income, the most directly comparable GAAP measure, and presents the computations of adjusted EBITDA margin and incremental adjusted EBITDA margin:
Three Months Ended
June 30,
2026 vs 2025
Six Months Ended
June 30,
2026 vs 2025
($ in thousands)
2026
2025
$ Change
2026
2025
$ Change
Net income (GAAP)
$
156,592
$
97,263
$
59,329
$
323,323
$
168,379
$
154,944
Non-GAAP adjustments:
Interest expense – corporate borrowings (1)
10,675
11,504
(829
)
21,326
22,932
(1,606
)
Income tax expense (2)
47,717
14,929
32,788
80,538
23,595
56,943
Depreciation and amortization
73,106
56,743
16,363
140,684
112,026
28,658
Share-based expense
76,865
63,256
13,609
148,877
127,012
21,865
Foreign currency impact of highly inflationary subsidiaries (3)
926
2,066
(1,140
)
1,337
2,342
(1,005
)
Servicing rights – change in valuation inputs or assumptions (4)
(13,142
)
3,274
(16,416
)
(26,305
)
2,200
(28,505
)
Residual interests classified as debt – change in valuation inputs or assumptions (5)
16
12
4
43
47
(4
)
Restructuring charges (6)
682
36
646
2,642
887
1,755
Transaction-related expense (7)
4,384
—
4,384
5,257
—
5,257
Total adjustments
201,229
151,820
49,409
374,399
291,041
83,358
Adjusted EBITDA (non-GAAP)
$
357,821
$
249,083
$
108,738
$
697,722
$
459,420
$
238,302
Total net revenue (GAAP)
$
1,218,676
$
854,944
$
363,732
$
2,319,044
$
1,626,703
$
692,341
Net income margin (GAAP)
13
%
11
%
14
%
10
%
Incremental net income margin (GAAP)
16
%
22
%
Adjusted net revenue (non-GAAP) (8)
$
1,205,550
$
858,230
$
347,320
$
2,292,782
$
1,628,950
$
663,832
Adjusted EBITDA margin (non-GAAP)
30
%
29
%
30
%
28
%
Incremental adjusted EBITDA margin (non-GAAP)
31
%
36
%
(1)
Our adjusted EBITDA measure adjusts for corporate borrowing-based interest expense, as these expenses are a function of our capital structure. Corporate borrowing-based interest expense includes interest on our revolving credit facility, as well as interest expense and the amortization of debt discount and debt issuance costs on our convertible notes.
(2)
The income tax expense recognized in both periods was primarily attributable to the Company’s profitability, partially offset by discrete tax benefits for stock compensation recorded in each quarter.
(3)
Foreign currency charges reflect the impacts of highly inflationary accounting for our operations in Argentina, which are related to our Technology Platform segment.
(4)
Reflects changes in fair value inputs and assumptions, including market servicing costs, conditional prepayment, default rates and discount rates. This non-cash change is unrealized during the period and, therefore, has no impact on our cash flows from operations. As such, these positive and negative changes in fair value attributable to assumption changes are adjusted out of net income to provide management and financial users with better visibility into the earnings available to finance our operations.
(5)
Reflects changes in fair value inputs and assumptions, including conditional prepayment, default rates and discount rates. When third parties finance our consolidated VIEs through purchasing residual interests, we receive proceeds at the time of the securitization close and, thereafter, pass along contractual cash flows to the residual interest owner. These obligations are measured at fair value on a recurring basis, which has no impact on our initial financing proceeds, our future obligations to the residual interest owner (because future residual interest claims are limited to contractual securitization collateral cash flows), or the general operations of our business. As such, these positive and negative non-cash changes in fair value attributable to assumption changes are adjusted out of net income to provide management and financial users with better visibility into the earnings available to finance our operations.
(6)
Restructuring charges in the 2026 periods included employee-related wages, benefits and severance associated with a small reduction in headcount in our Technology Platform segment, which do not reflect expected future operating expenses and are not indicative of our core operating performance. Restructuring charges in 2025 relate to legal entity restructuring.
(7)
Transaction-related expenses in 2026 periods primarily included financial advisory and professional services costs associated with our acquisitions of Composer and Peach.
(8)
Refer to 'Adjusted Net Revenue' above for reconciliation of this non-GAAP measure.
Tangible Book Value and Tangible Book Value per Common Share
Tangible book value is defined as permanent equity, adjusted to exclude goodwill and intangible assets, net of related deferred tax liabilities. Tangible book value per common share represents tangible book value at period-end divided by common stock outstanding at period-end. Prior periods were revised to conform with this presentation.
These measures are utilized by management in assessing our use of equity and capital adequacy. We believe that tangible book value presents a meaningful measure of net asset value, and tangible book value per share provides additional useful information to investors to assess capital adequacy.
The following table reconciles tangible book value to permanent equity, the most directly comparable GAAP measure, and presents the computation of permanent equity per common share and tangible book value per common share for the periods presented:
($ and shares in thousands, except per share amounts)
June 30,
2026
June 30,
2025
Equity (GAAP)
$
11,076,227
$
6,860,580
Non-GAAP adjustments:
Goodwill
(1,425,015
)
(1,393,505
)
Intangible assets
(226,528
)
(263,522
)
Related deferred tax liabilities
45,536
51,322
Tangible book value (as of period end) (non-GAAP)
$
9,470,220
$
5,254,875
Common stock outstanding (as of period end)
1,290,312
1,113,443
Book value per common share (GAAP)
$
8.58
$
6.16
Tangible book value per common share (non-GAAP)
$
7.34
$
4.72
Adjusted Net Income, Adjusted Net Income Margin, Incremental Adjusted Net Income Margin and Adjusted EPS
Adjusted net income, adjusted net income margin, incremental adjusted net income margin and adjusted diluted earnings per share are non-GAAP measures. Adjusted net income is defined as net income, adjusted to exclude, as applicable, transaction-related expense, restructuring charges, goodwill impairment expense and certain income tax benefits that are not expected to recur and are not indicative of our core operating performance.
Adjusted diluted earnings per share (“adjusted EPS”) is a non-GAAP financial measure that adjusts GAAP diluted earnings per share. Adjusted EPS is computed by dividing net income attributable to common stockholders, adjusted to exclude, as applicable, transaction-related expense, restructuring charges, goodwill impairment expense and certain income tax benefits that are not expected to recur and are not indicative of our core operating performance, by the diluted weighted average number of shares of common stock outstanding during the period, excluding the dilutive impact of the 2026 and 2029 convertible notes under the if-converted method for which the 2026 and 2029 capped call transactions, respectively, would deliver cash or shares to offset dilution. The exclusions of transaction-related expense and restructuring charges were effective beginning in the second quarter of 2026. The impact to prior periods was determined to be immaterial, and therefore prior periods were not recast.
Adjusted net income margin is computed as adjusted net income divided by adjusted net revenue. Incremental adjusted net income margin is defined as the change in adjusted net income, divided by change in adjusted net revenue. See ‘Adjusted Net Revenue’ above for a reconciliation of this non-GAAP measure.
Management believes adjusted net income, adjusted net income margin, incremental adjusted net income margin and adjusted EPS are useful because they enable management and investors to assess our core operating performance or results of operations, by removing the effects of certain non cash items and charges to present a comparable view for period over period comparisons of our business.
The following table: (i) reconciles adjusted net income to net income, the most directly comparable GAAP measure, (ii) reconciles adjusted EPS to diluted earnings per share, the most directly comparable GAAP measure, and (iii) presents the computations of adjusted net income margin and incremental adjusted net income margin.
($ and shares in thousands, except per share amounts) (1)
Three Months Ended
June 30,
2026 vs 2025
Six Months Ended
June 30,
2026 vs 2025
2026
2025
$ Change
2026
2025
$ Change
Net income (GAAP)
$
156,592
$
97,263
$
59,329
$
323,323
$
168,379
$
154,944
Non-GAAP adjustments:
Restructuring charges
682
—
682
682
—
682
Transaction-related expense
4,384
—
4,384
4,384
—
4,384
Tax impacts from adjustments
(1,252
)
—
(1,252
)
(1,252
)
—
(1,252
)
Adjusted net income (non-GAAP)
$
160,406
$
97,263
$
63,143
$
327,137
$
168,379
$
158,758
Numerator:
Net income attributable to common stockholders – diluted (GAAP) (2)
$
156,645
$
97,614
$
323,720
$
169,069
Non-GAAP adjustments:
Restructuring charges
682
—
682
—
Transaction-related expense
4,384
—
4,384
—
Tax impacts from adjustments
(1,252
)
—
(1,252
)
—
Adjusted net income attributable to common stockholders – diluted (non-GAAP)
$
160,459
$
97,614
$
327,534
$
169,069
Denominator:
Weighted average common stock outstanding – diluted
1,351,990
1,182,877
1,364,978
1,184,197
Non-GAAP adjustments:
Dilutive impact of convertible notes (3)
(27,412
)
(25,857
)
(24,722
)
(28,635
)
Adjusted weighted average common stock outstanding — diluted (non-GAAP)
1,324,578
1,157,020
1,340,256
1,155,562
Earnings per share – diluted (GAAP) (2)
$
0.12
$
0.08
$
0.24
$
0.14
Impact of adjustments per share
—
—
—
0.01
Adjusted earnings per share – diluted (non-GAAP) (2)
$
0.12
$
0.08
$
0.24
$
0.15
Net income margin (GAAP)
13
%
11
%
14
%
10
%
Adjusted net revenue (non-GAAP) (4)
$
1,205,550
$
858,230
$
2,292,782
$
1,628,950
Adjusted net income margin (non-GAAP)
13
%
11
%
14
%
10
%
Incremental adjusted net income margin (non-GAAP)
18
%
24
%
(1)
Certain amounts may not recalculate exactly using the rounded amounts provided. Earnings per share is calculated based on unrounded numbers.
(2)
Diluted earnings per share and diluted net income attributable to common stockholders exclude gain on extinguishment of debt, net of tax, as well as interest expense incurred, net of tax, associated with convertible note activity during the period as evaluated under the if-converted method.
(3)
This non-GAAP adjustment excludes the dilutive impact of the 2026 and 2029 convertible notes, to the extent that the 2026 and 2029 capped call transactions, respectively, would deliver cash or shares to offset dilution.
(4)
Refer to 'Adjusted Net Revenue' above for reconciliation of this non-GAAP measure.
Table 3
SoFi Technologies, Inc.
Condensed Consolidated Balance Sheets
(Unaudited)
(In Thousands, Except for Share Data)
June 30,
2026
December 31,
2025
Assets
Cash and cash equivalents
$
3,126,237
$
4,929,452
Restricted cash and restricted cash equivalents
439,322
427,321
Investment securities (includes available-for-sale securities of $3,993,310 and $2,454,453 at fair value with associated amortized cost of $3,993,321 and $2,434,627, as of June 30, 2026 and December 31, 2025, respectively)
4,225,652
2,575,607
Loans held for sale (includes $29.7 billion and $22.7 billion at fair value, as of June 30, 2026 and December 31, 2025, respectively)
29,737,289
22,862,749
Loans held for investment, at fair value
16,920,564
13,657,578
Loans held for investment, at amortized cost (less allowance for credit losses of $56,459 and $50,934, as of June 30, 2026 and December 31, 2025, respectively)
1,275,529
1,516,736
Servicing rights
364,318
378,178
Property, equipment and software
496,712
416,448
Goodwill
1,425,015
1,393,505
Intangible assets
226,528
231,919
Operating lease right-of-use assets
86,149
93,941
Other assets (less allowance for credit losses of $2,557 and $2,998, as of June 30, 2026 and December 31, 2025, respectively)
2,624,233
2,177,044
Total assets
$
60,947,548
$
50,660,478
Liabilities and equity
Liabilities:
Deposits:
Interest-bearing deposits
$
45,416,257
$
37,387,350
Noninterest-bearing deposits
126,903
118,045
Total deposits
45,543,160
37,505,395
Accounts payable, accruals and other liabilities
923,024
743,716
Operating lease liabilities
104,083
106,190
Debt
3,300,544
1,815,162
Residual interests classified as debt
510
520
Total liabilities
49,871,321
40,170,983
Commitments, guarantees, concentrations and contingencies
Equity:
Common stock, $0.00 par value: 3,100,000,000 and 3,100,000,000 shares authorized; 1,290,312,404 and 1,270,568,878 shares issued and outstanding as of June 30, 2026 and December 31, 2025, respectively
128
126
Additional paid-in capital
11,589,035
11,302,668
Accumulated other comprehensive income (loss)
(11,981
)
10,979
Accumulated deficit
(500,955
)
(824,278
)
Total equity
11,076,227
10,489,495
Total liabilities and equity
$
60,947,548
$
50,660,478
Table 4
SoFi Technologies, Inc.
Average Balances and Net Interest Earnings Analysis
(Unaudited)
Three Months Ended
June 30, 2026
Three Months Ended
June 30, 2025
($ in thousands)
Average Balances
Interest Income/Expense
Average Yield/Rate
Average Balances
Interest Income/Expense
Average Yield/Rate
Assets
Interest-earning assets:
Interest-bearing deposits with banks
$
3,790,852
$
32,430
3.43
%
$
2,811,423
$
25,086
3.58
%
Investment securities
3,688,523
42,129
4.58
2,277,616
29,878
5.26
Loans
45,380,080
1,065,969
9.42
30,331,237
737,441
9.75
Total interest-earning assets
52,859,455
1,140,528
8.65
35,420,276
792,405
8.97
Total noninterest-earning assets
4,376,513
3,944,524
Total assets
$
57,235,968
$
39,364,800
Liabilities and Equity
Interest-bearing liabilities:
Demand deposits
$
3,644,040
$
10,336
1.14
%
$
2,063,657
$
2,696
0.52
%
Savings deposits
36,059,867
289,065
3.22
25,264,749
226,394
3.59
Time deposits
2,212,570
21,062
3.82
487,916
4,142
3.40
Total interest-bearing deposits
41,916,477
320,463
3.07
27,816,322
233,232
3.36
Warehouse facilities
1,475,784
17,039
4.63
2,137,160
27,874
5.23
Securitization debt
49,800
529
4.26
62,432
554
3.56
Other debt
1,979,602
14,302
2.90
1,757,224
12,908
2.95
Total debt
3,505,186
31,870
3.65
3,956,816
41,336
4.19
Residual interests classified as debt
518
—
—
561
—
—
Total interest-bearing liabilities
45,422,181
352,333
3.11
31,773,699
274,568
3.47
Total noninterest-bearing liabilities
1,181,640
919,349
Total liabilities
46,603,821
32,693,048
Total equity
10,632,147
6,671,752
Total liabilities and equity
$
57,235,968
$
39,364,800
Net interest income
$
788,195
$
517,837
Net interest margin
5.98
%
5.86
%
Six Months Ended
June 30, 2026
Six Months Ended
June 30, 2025
($ in thousands)
Average Balances
Interest Income/Expense
Average Yield/Rate
Average Balances
Interest Income/Expense
Average Yield/Rate
Assets
Interest-earning assets:
Interest-bearing deposits with banks
$
4,139,321
$
70,179
3.42
%
$
2,751,678
$
51,073
3.74
%
Investment securities
3,208,207
74,869
4.71
2,153,794
56,222
5.26
Loans
42,916,601
1,996,476
9.38
29,608,981
1,448,922
9.87
Total interest-earning assets
50,264,129
2,141,524
8.59
34,514,453
1,556,217
9.09
Total noninterest-earning assets
4,354,094
3,902,786
Total assets
$
54,618,223
$
38,417,239
Liabilities, Temporary Equity and Permanent Equity
Interest-bearing liabilities:
Demand deposits
$
3,528,845
$
18,731
1.07
%
$
1,964,252
$
5,067
0.52
%
Savings deposits
34,709,922
557,367
3.24
24,484,120
443,065
3.65
Time deposits
1,613,710
31,593
3.95
557,151
10,499
3.80
Total interest-bearing deposits
39,852,477
607,691
3.07
27,005,523
458,631
3.42
Warehouse facilities
1,103,425
25,338
4.63
2,063,312
54,264
5.30
Securitization debt
51,423
918
3.60
68,034
1,135
3.36
Other debt
1,871,195
26,394
2.84
1,756,459
25,624
2.94
Total debt
3,026,043
52,650
3.51
3,887,805
81,023
4.20
Residual interests classified as debt
514
—
—
568
—
—
Total interest-bearing liabilities
42,879,034
660,341
3.11
30,893,896
539,654
3.52
Total noninterest-bearing liabilities
1,200,999
885,613
Total liabilities
44,080,033
31,779,509
Total equity
10,538,190
6,637,730
Total liabilities and equity
$
54,618,223
$
38,417,239
Net interest income
$
1,481,183
$
1,016,563
Net interest margin
5.94
%
5.94
%
Table 5
Company Metrics
June 30, 2026
March 31, 2026
December 31, 2025
September 30, 2025
June 30, 2025
March 31, 2025
December 31, 2024
September 30, 2024
June 30, 2024
Members
15,814,418
14,706,040
13,651,002
12,642,375
11,745,572
10,915,811
10,127,323
9,372,615
8,774,236
Total Products
24,380,974
22,159,146
20,168,142
18,553,053
17,142,041
15,915,425
14,745,435
13,650,730
12,776,430
Total Products — Lending segment
3,093,359
2,831,352
2,633,186
2,462,588
2,280,368
2,129,833
2,010,354
1,890,761
1,786,580
Total Products — Financial Services segment
21,287,615
19,327,794
17,534,956
16,090,465
14,861,673
13,785,592
12,735,081
11,759,969
10,989,850
Total Accounts — Technology Platform segment
134,804,238
132,874,105
128,461,873
157,859,670
160,046,369
158,432,347
167,713,818
160,179,299
158,485,125
Members
We refer to our customers as “members”. We define a member as someone who has a lending relationship with us through origination and/or ongoing servicing, opened a financial services account, linked an external account to our platform, or signed up for our credit score monitoring service. Our members have access to our CFPs, our member events, our content, educational material, news, and our tools and calculators, which are provided at no cost to the member. We view members as an indication not only of the size and a measurement of growth of our business, but also as a measure of the significant value of the data we have collected over time.
Once someone becomes a member, they are always considered a member unless they are removed in accordance with our terms of service, in which case, we adjust our total number of members. This could occur for a variety of reasons—including fraud or pursuant to certain legal processes—and, as our terms of service evolve together with our business practices, product offerings and applicable regulations, our grounds for removing members from our total member count could change. The determination that a member should be removed in accordance with our terms of service is subject to an evaluation process, following the completion, and based on the results, of which, relevant members and their associated products are removed from our total member count in the period in which such evaluation process concludes. However, depending on the length of the evaluation process, that removal may not take place in the same period in which the member was added to our member count or the same period in which the circumstances leading to their removal occurred. For this reason, our total member count may not yet reflect adjustments that may be made once ongoing evaluation processes, if any, conclude. Beginning in the first quarter of 2024, we aligned our methodology for calculating member and product metrics with our member and product definitions to include co-borrowers, co-signers, and joint- and co-account holders, as applicable. Quarterly amounts for prior periods were determined to be immaterial and were not recast.
Total Products
Total products refers to the aggregate number of lending and financial services products that our members have selected on our platform since our inception through the reporting date, whether or not the members are still registered for such products. Total products is a primary indicator of the size and reach of our Lending and Financial Services segments. Management relies on total products metrics to understand the effectiveness of our member acquisition efforts and to gauge the propensity for members to use more than one product.
In our Lending segment, total products refers to the number of personal loans, student loans and home loans that have been originated through our platform through the reporting date, inclusive of loans which we originate as part of our Loan Platform Business, whether or not such loans have been paid off. If a member has multiple loan products of the same loan product type, such as two personal loans, that is counted as a single product. However, if a member has multiple loan products across loan product types, such as one personal loan and one home loan, that is counted as two products. The account of a co-borrower or co-signer is not considered a separate lending product.
In our Financial Services segment, total products refers to the number of SoFi Money accounts (inclusive of checking and savings accounts held at SoFi Bank and cash management accounts), SoFi Invest accounts, SoFi Credit Card accounts (including Smart Card accounts and accounts with a zero dollar balance at the reporting date), referred loans (which are originated by a third-party partner to which we provide pre-qualified borrower referrals), SoFi At Work accounts, SoFi Relay accounts (with either credit score monitoring enabled or external linked accounts), and SoFi Crypto accounts that have been opened through our platform through the reporting date, as well as active SoFi Plus subscriptions as of the reporting date. Checking and savings accounts are considered one account within our total products metric. Our SoFi Invest service is composed of four products: IRA self-directed accounts, taxable self-directed accounts, IRA robo-advisory accounts, and taxable robo-advisory accounts. Our members can select any one or combination of the SoFi Invest products. If a member has multiple SoFi Invest accounts of the same products, such as one IRA self-directed account and one IRA robo-advisory account (or one tax-advantaged brokerage account and one taxable brokerage account), those are considered separate products. The account of a joint- or co-account holder is considered a separate financial services product. In the event a member is removed in accordance with our terms of service, as discussed under “Members” above, the member’s associated products are also removed.
Technology Platform Total Accounts
In our Technology Platform segment, total accounts refers to the number of open accounts at Galileo as of the reporting date. We include intercompany accounts on the Galileo platform as a service in our total accounts metric to better align with the Technology Platform segment revenue which includes intercompany revenue. Intercompany revenue is eliminated in consolidation. Total accounts is a primary indicator of the accounts dependent upon our technology platform to use virtual card products, virtual wallets, make peer-to-peer and bank-to-bank transfers, receive early paychecks, separate savings from spending balances, make debit transactions and rely upon real-time authorizations, all of which result in revenues for the Technology Platform segment. We do not measure total accounts for other products and solutions for which the revenue model is not primarily dependent upon being a fully integrated, stand-ready service.
Table 6
Segment Financials
(Unaudited)
Quarter Ended
($ and shares in thousands)
June 30, 2026
March 31, 2026
December 31, 2025
September 30, 2025
June 30, 2025
March 31, 2025
December 31, 2024
September 30, 2024
June 30, 2024
Lending
Net interest income
$
573,298
$
500,231
$
444,763
$
427,973
$
372,675
$
360,621
$
345,210
$
316,268
$
279,212
Total noninterest income
151,500
142,189
53,919
65,409
70,837
52,752
72,586
79,977
61,493
Total net revenue
724,798
642,420
498,682
493,382
443,512
413,373
417,796
396,245
340,705
Adjusted net revenue – Lending (1)
711,672
629,284
486,466
481,408
446,798
412,334
422,783
391,892
339,052
Contribution profit – Lending (2)
399,033
382,386
271,655
261,600
244,710
238,935
245,958
238,928
197,938
Technology Platform
Net interest income
$
1,022
$
355
$
394
$
432
$
266
$
413
$
473
$
629
$
555
Total noninterest income
83,483
74,731
121,979
114,146
109,567
103,014
102,362
101,910
94,883
Total net revenue (2)
84,505
75,086
122,373
114,578
109,833
103,427
102,835
102,539
95,438
Contribution profit – Technology Platform
11,772
11,999
47,934
32,371
33,195
30,913
32,107
32,955
31,151
Financial Services
Net interest income
$
249,052
$
227,740
$
207,810
$
203,660
$
193,322
$
173,199
$
160,337
$
154,143
$
139,229
Total noninterest income
217,226
200,803
248,931
215,963
169,211
129,920
96,183
84,165
36,903
Total net revenue
466,278
428,543
456,741
419,623
362,533
303,119
256,520
238,308
176,132
Contribution profit – Financial Services (2)
212,676
195,584
230,788
225,557
188,232
148,332
114,855
99,758
55,220
Corporate/Other
Net interest income (expense)
$
(35,177
)
$
(35,338
)
$
(35,688
)
$
(46,951
)
$
(48,426
)
$
(35,507
)
$
(35,851
)
$
(40,030
)
$
(6,412
)
Total noninterest income (loss)
(21,728
)
(10,343
)
(17,057
)
(19,032
)
(12,508
)
(12,653
)
(7,175
)
59
(7,245
)
Total net revenue (loss) (2)
(56,905
)
(45,681
)
(52,745
)
(65,983
)
(60,934
)
(48,160
)
(43,026
)
(39,971
)
(13,657
)
Consolidated
Net interest income
$
788,195
$
692,988
$
617,279
$
585,114
$
517,837
$
498,726
$
470,169
$
431,010
$
412,584
Total noninterest income
430,481
407,380
407,772
376,486
337,107
273,033
263,956
266,111
186,034
Total net revenue
1,218,676
1,100,368
1,025,051
961,600
854,944
771,759
734,125
697,121
598,618
Adjusted net revenue (1)
1,205,550
1,087,232
1,012,835
949,626
858,230
770,720
739,112
689,445
596,965
Net income
156,592
166,731
173,549
139,392
97,263
71,116
332,473
60,745
17,404
Adjusted EBITDA (1)
357,821
339,901
317,597
276,881
249,083
210,337
197,957
186,237
137,901
(1)
Adjusted net revenue and adjusted EBITDA are non-GAAP financial measures. For additional information on these measures and reconciliations to the most directly comparable GAAP measures, see “Non-GAAP Financial Measures” and Table 2 to the “Financial Tables” herein.
(2)
Technology Platform segment total net revenue includes intercompany fees. The equal and offsetting intercompany expenses are reflected within all three segments’ directly attributable expenses, as well as within expenses not allocated to segments. The intercompany revenues and expenses are eliminated in consolidation. The revenues are eliminated within Corporate/Other and the expenses represent a reconciling item of segment contribution profit (loss) to consolidated income (loss) before income taxes.
Table 7
Fee-Based Revenue
(Unaudited)
Three Months Ended
June 30,
Six Months Ended
June 30,
($ in thousands)
2026
2025
2026
2025
Loan platform fees
$
116,572
$
104,857
$
235,550
$
177,907
Referrals, loan platform business
24,358
22,548
43,635
42,248
Total Loan platform fees
140,930
127,405
279,185
220,155
Referrals, other
3,701
2,588
7,457
5,118
Interchange
44,128
26,502
79,329
49,314
Brokerage
18,127
7,542
33,231
14,527
Loan origination fees
198,505
120,758
336,783
222,756
Technology services
50,512
89,574
99,296
175,562
Net crypto transaction revenue (1)
1,183
—
2,035
—
Other
15,236
3,136
21,766
5,503
Total fee-based revenue
$
472,322
$
377,505
$
859,082
$
692,935
(1)
In the fourth quarter of 2025, the Company launched SoFi Crypto, which gives members the ability to buy, sell and hold digital assets. Net crypto transaction revenue primarily consists of transaction fees earned from facilitating member buy and sell orders on our platform.
Table 8
Analysis of Charge-Offs
(Unaudited)
Three Months Ended
June 30, 2026
Three Months Ended
June 30, 2025
($ in thousands)
Average Loans
Net Charge-offs
Ratio
Average Loans
Net Charge-offs
Ratio
Personal loans
$
26,183,468
$
171,015
2.62
%
$
18,414,581
$
129,970
2.83
%
Student loans
15,971,158
24,266
0.61
%
10,107,155
23,747
0.94
%
Home loans
1,886,768
—
—
%
540,994
—
—
%
Secured loans
674,915
—
—
%
770,154
—
—
%
Credit card
483,283
9,212
7.65
%
342,051
6,565
7.70
%
Commercial and consumer banking
180,488
18
0.04
%
156,302
1
—
%
Total loans
$
45,380,080
$
204,511
1.81
%
$
30,331,237
$
160,283
2.12
%
Six Months Ended
June 30, 2026
Six Months Ended
June 30, 2025
($ in thousands)
Average Loans
Net Charge-offs
Ratio
Average Loans
Net Charge-offs
Ratio
Personal loans
$
24,667,205
$
341,836
2.79
%
$
18,345,733
$
280,044
3.08
%
Student loans
15,211,161
47,185
0.63
%
9,579,563
34,344
0.72
%
Home loans
1,646,192
—
—
%
447,541
—
—
%
Secured loans
739,993
—
—
%
762,819
—
—
%
Credit card
473,699
16,859
7.18
%
318,436
14,555
9.22
%
Commercial and consumer banking
178,351
266
0.31
%
154,889
4
0.01
%
Total loans
$
42,916,601
$
406,146
1.91
%
$
29,608,981
$
328,947
2.24
%
Table 9
Regulatory Capital
(Unaudited)
June 30, 2026
June 30, 2025
($ in thousands)
Amount (1)
Ratio (1)
Amount
Ratio
Required Minimum (2)
SoFi Technologies
CET1 risk-based capital
$
9,112,891
18.7
%
$
4,804,043
14.3
%
7.0
%
Tier 1 risk-based capital
9,112,891
18.7
%
4,804,043
14.3
%
8.5
%
Total risk-based capital
9,169,159
18.8
%
4,851,605
14.4
%
10.5
%
Tier 1 leverage
9,112,891
16.5
%
4,804,043
12.9
%
4.0
%
Risk-weighted assets
48,682,417
33,579,874
Quarterly adjusted average assets
55,260,718
37,311,694
(1)
Estimated.
(2)
Required minimums presented for risk-based capital ratios include the required capital conservation buffer.